29
/
en
AIzaSyAYiBZKx7MnpbEhh9jyipgxe19OcubqV5w
April 1, 2024
249958
St. Kitts and Nevis
KNA
true
2
1
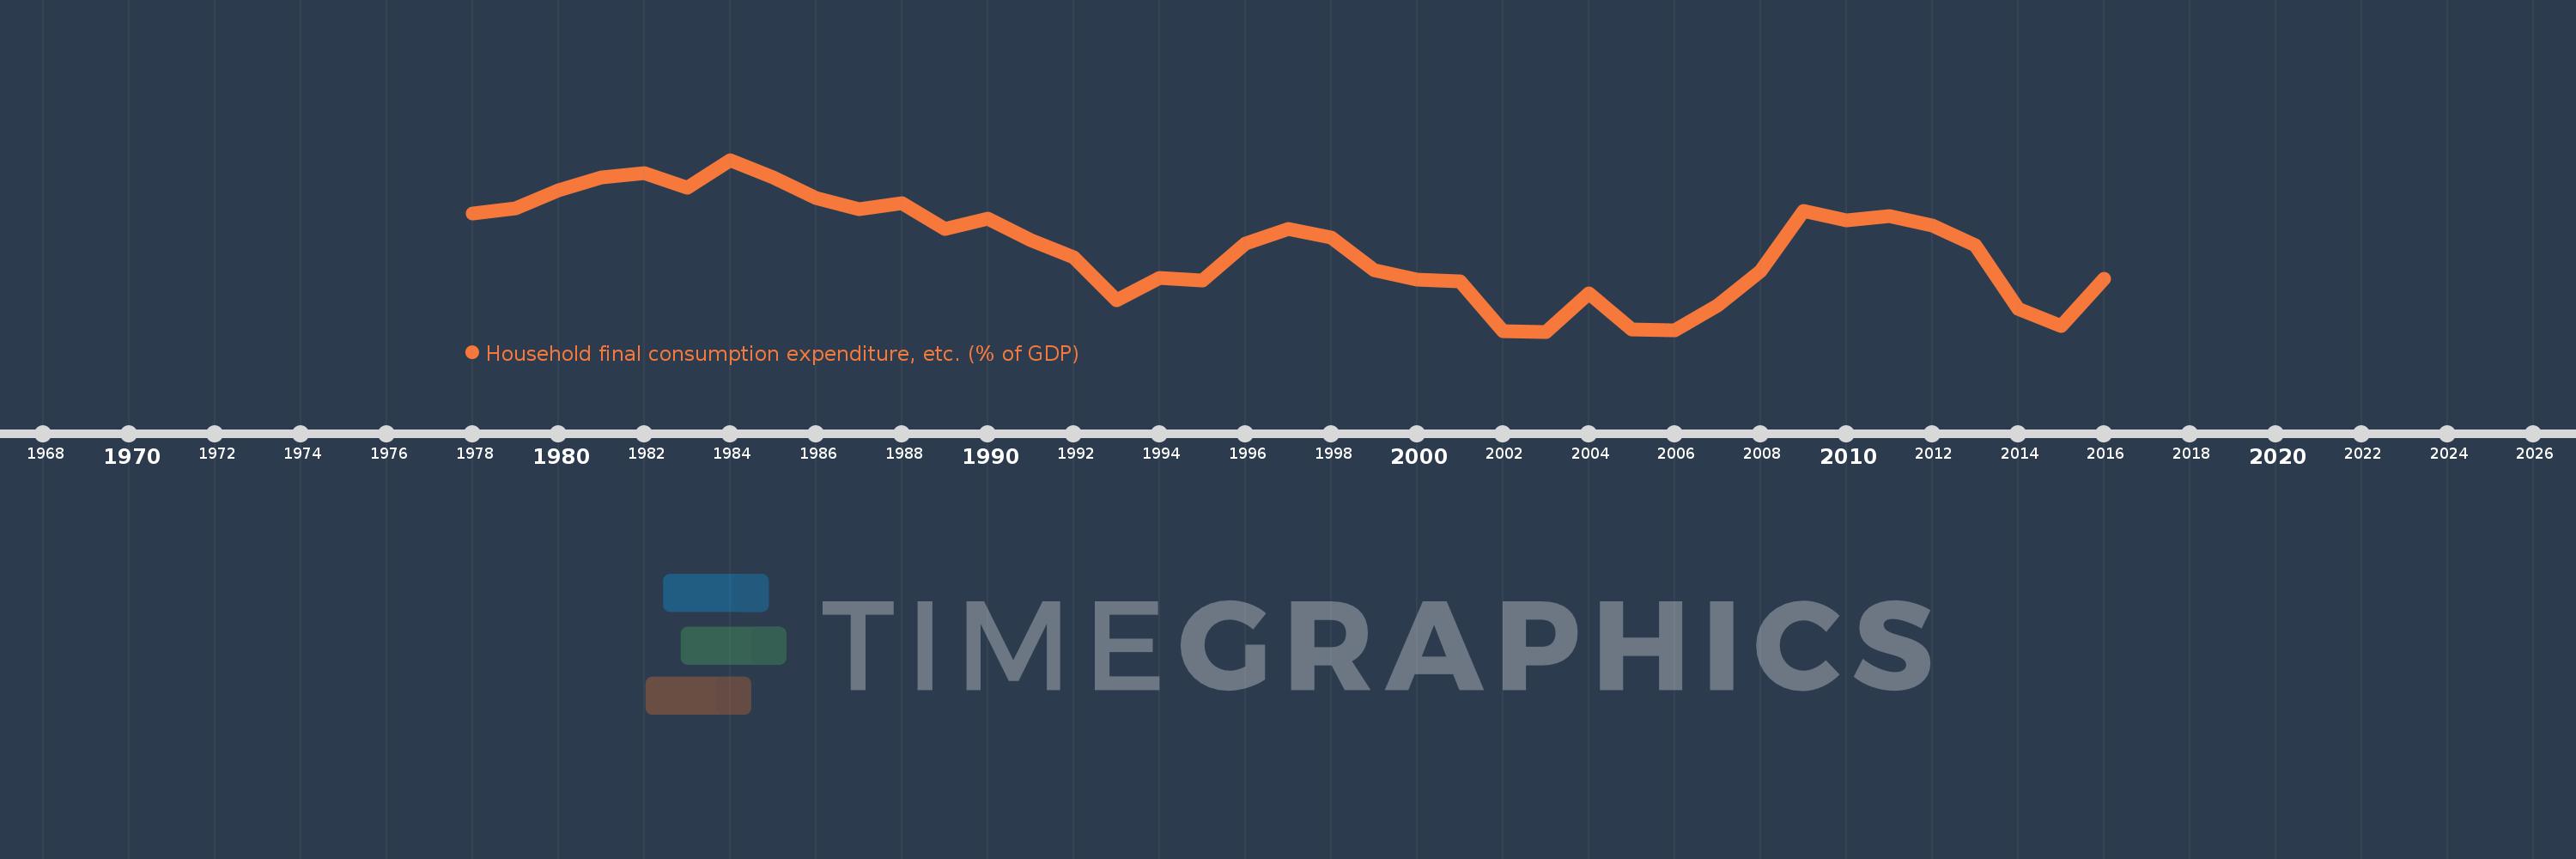
Household final consumption expenditure, etc. (% of GDP)
2016,2015,2014,2013,2012,2011,2010,2009,2008,2007,2006,2005,2004,2003,2002,2001,2000,1999,1998,1997,1996,1995,1994,1993,1992,1991,1990,1989,1988,1987,1986,1985,1984,1983,1982,1981,1980,1979,1978
This statistics in other country:
AfghanistanAlbaniaAlgeriaAngolaAntigua and BarbudaArab WorldArgentinaArmeniaArubaAustraliaAustriaAzerbaijanBahamas, TheBahrainBangladeshBarbadosBelarusBelgiumBelizeBeninBermudaBhutanBoliviaBosnia and HerzegovinaBotswanaBrazilBrunei DarussalamBulgariaBurkina FasoBurundiCabo VerdeCambodiaCameroonCanadaCaribbean small statesCentral African RepublicCentral Europe and the BalticsChadChileChinaColombiaComorosCongo, Dem. Rep.Congo, Rep.Costa RicaCote d'IvoireCroatiaCubaCyprusCzech RepublicDenmarkDjiboutiDominicaDominican RepublicEarly-demographic dividendEast Asia & PacificEast Asia & Pacific (excluding high income)East Asia & Pacific (IDA & IBRD countries)EcuadorEgypt, Arab Rep.El SalvadorEquatorial GuineaEritreaEstoniaEthiopiaEuro areaEurope & Central AsiaEurope & Central Asia (excluding high income)Europe & Central Asia (IDA & IBRD countries)European UnionFaroe IslandsFijiFinlandFragile and conflict affected situationsFranceGabonGambia, TheGeorgiaGermanyGhanaGreeceGrenadaGuatemalaGuineaGuinea-BissauGuyanaHaitiHeavily indebted poor countries (HIPC)High incomeHondurasHong Kong SAR, ChinaHungaryIBRD onlyIcelandIDA & IBRD totalIDA blendIDA onlyIDA totalIndiaIndonesiaIran, Islamic Rep.IraqIrelandIsraelItalyJamaicaJapanJordanKazakhstanKenyaKiribatiKorea, Rep.KosovoKuwaitKyrgyz RepublicLao PDRLate-demographic dividendLatin America & Caribbean Latin America & Caribbean (excluding high income)Latin America & the Caribbean (IDA & IBRD countries)LatviaLeast developed countries: UN classificationLebanonLesothoLiberiaLibyaLithuaniaLow & middle incomeLow incomeLower middle incomeLuxembourgMacao SAR, ChinaMacedonia, FYRMadagascarMalawiMalaysiaMaldivesMaliMaltaMauritaniaMauritiusMexicoMicronesia, Fed. Sts.Middle East & North AfricaMiddle East & North Africa (excluding high income)Middle East & North Africa (IDA & IBRD countries)Middle incomeMoldovaMongoliaMontenegroMoroccoMozambiqueNamibiaNepalNetherlandsNew CaledoniaNew ZealandNicaraguaNigerNigeriaNorth AmericaNorwayOECD membersOmanOther small statesPacific island small statesPakistanPanamaPapua New GuineaParaguayPeruPhilippinesPolandPortugalPost-demographic dividendPre-demographic dividendPuerto RicoQatarRomaniaRussian FederationRwandaSaudi ArabiaSenegalSerbiaSeychellesSierra LeoneSingaporeSlovak RepublicSloveniaSmall statesSolomon IslandsSomaliaSouth AfricaSouth AsiaSouth Asia (IDA & IBRD)South SudanSpainSri LankaSt. Kitts and NevisSt. LuciaSt. Vincent and the GrenadinesSub-Saharan Africa Sub-Saharan Africa (excluding high income)Sub-Saharan Africa (IDA & IBRD countries)SudanSurinameSwazilandSwedenSwitzerlandSyrian Arab RepublicTajikistanTanzaniaThailandTimor-LesteTogoTongaTrinidad and TobagoTunisiaTurkeyTurkmenistanUgandaUkraineUnited Arab EmiratesUnited KingdomUnited StatesUpper middle incomeUruguayUzbekistanVanuatuVenezuela, RBVietnamWest Bank and GazaWorldYemen, Rep.ZambiaZimbabwe Timeline:
This timeline shows a graph from 1978 to 2016 of St. Kitts and Nevis. No data until 1977. Number of actual observations by date: 39.
Source name:
World Development Indicators
Source organization:
World Bank national accounts data, and OECD National Accounts data files.
Categories, topics:
Economy & Growth
Last updated:
apr 23, 2017
Indicators value changes by year
Minimum:
49.559
jan 1, 2003
Maximum:
88.532
jan 1, 1984
At the date of observation
Value
Absolute change
Change from previous value
jan 1, 1978
76.325
+76.325
0.0%
jan 1, 1979
77.459
+1.133
1.48%
jan 1, 1980
81.563
+4.104
5.3%
jan 1, 1981
84.532
+2.969
3.64%
jan 1, 1982
85.453
+0.92
1.09%
jan 1, 1983
82.241
-3.211
-3.76%
jan 1, 1984
88.532
+6.291
7.65%
jan 1, 1985
84.47
-4.062
-4.59%
jan 1, 1986
79.889
-4.582
-5.42%
jan 1, 1987
77.374
-2.515
-3.15%
jan 1, 1988
78.597
+1.224
1.58%
jan 1, 1989
72.93
-5.667
-7.21%
jan 1, 1990
75.14
+2.209
3.03%
jan 1, 1991
70.268
-4.872
-6.48%
jan 1, 1992
66.346
-3.922
-5.58%
jan 1, 1993
56.594
-9.752
-14.7%
jan 1, 1994
61.669
+5.075
8.97%
jan 1, 1995
61.12
-0.549
-0.89%
jan 1, 1996
69.523
+8.403
13.75%
jan 1, 1997
72.91
+3.387
4.87%
jan 1, 1998
70.918
-1.992
-2.73%
jan 1, 1999
63.525
-7.393
-10.42%
jan 1, 2000
61.406
-2.119
-3.33%
jan 1, 2001
61.047
-0.36
-0.59%
jan 1, 2002
49.727
-11.319
-18.54%
jan 1, 2003
49.559
-0.168
-0.34%
jan 1, 2004
58.17
+8.611
17.38%
jan 1, 2005
49.98
-8.19
-14.08%
jan 1, 2006
49.838
-0.141
-0.28%
jan 1, 2007
55.516
+5.677
11.39%
jan 1, 2008
63.21
+7.694
13.86%
jan 1, 2009
76.98
+13.77
21.79%
jan 1, 2010
74.758
-2.221
-2.89%
jan 1, 2011
75.793
+1.035
1.38%
jan 1, 2012
73.588
-2.205
-2.91%
jan 1, 2013
69.102
-4.486
-6.1%
jan 1, 2014
54.64
-14.462
-20.93%
jan 1, 2015
50.732
-3.908
-7.15%
jan 1, 2016
61.516
+10.784
21.26%
Ranking of countries by current statistics by years


Comments: