29
/
en
AIzaSyAYiBZKx7MnpbEhh9jyipgxe19OcubqV5w
April 1, 2024
256435
Sweden
SWE
true
2
1
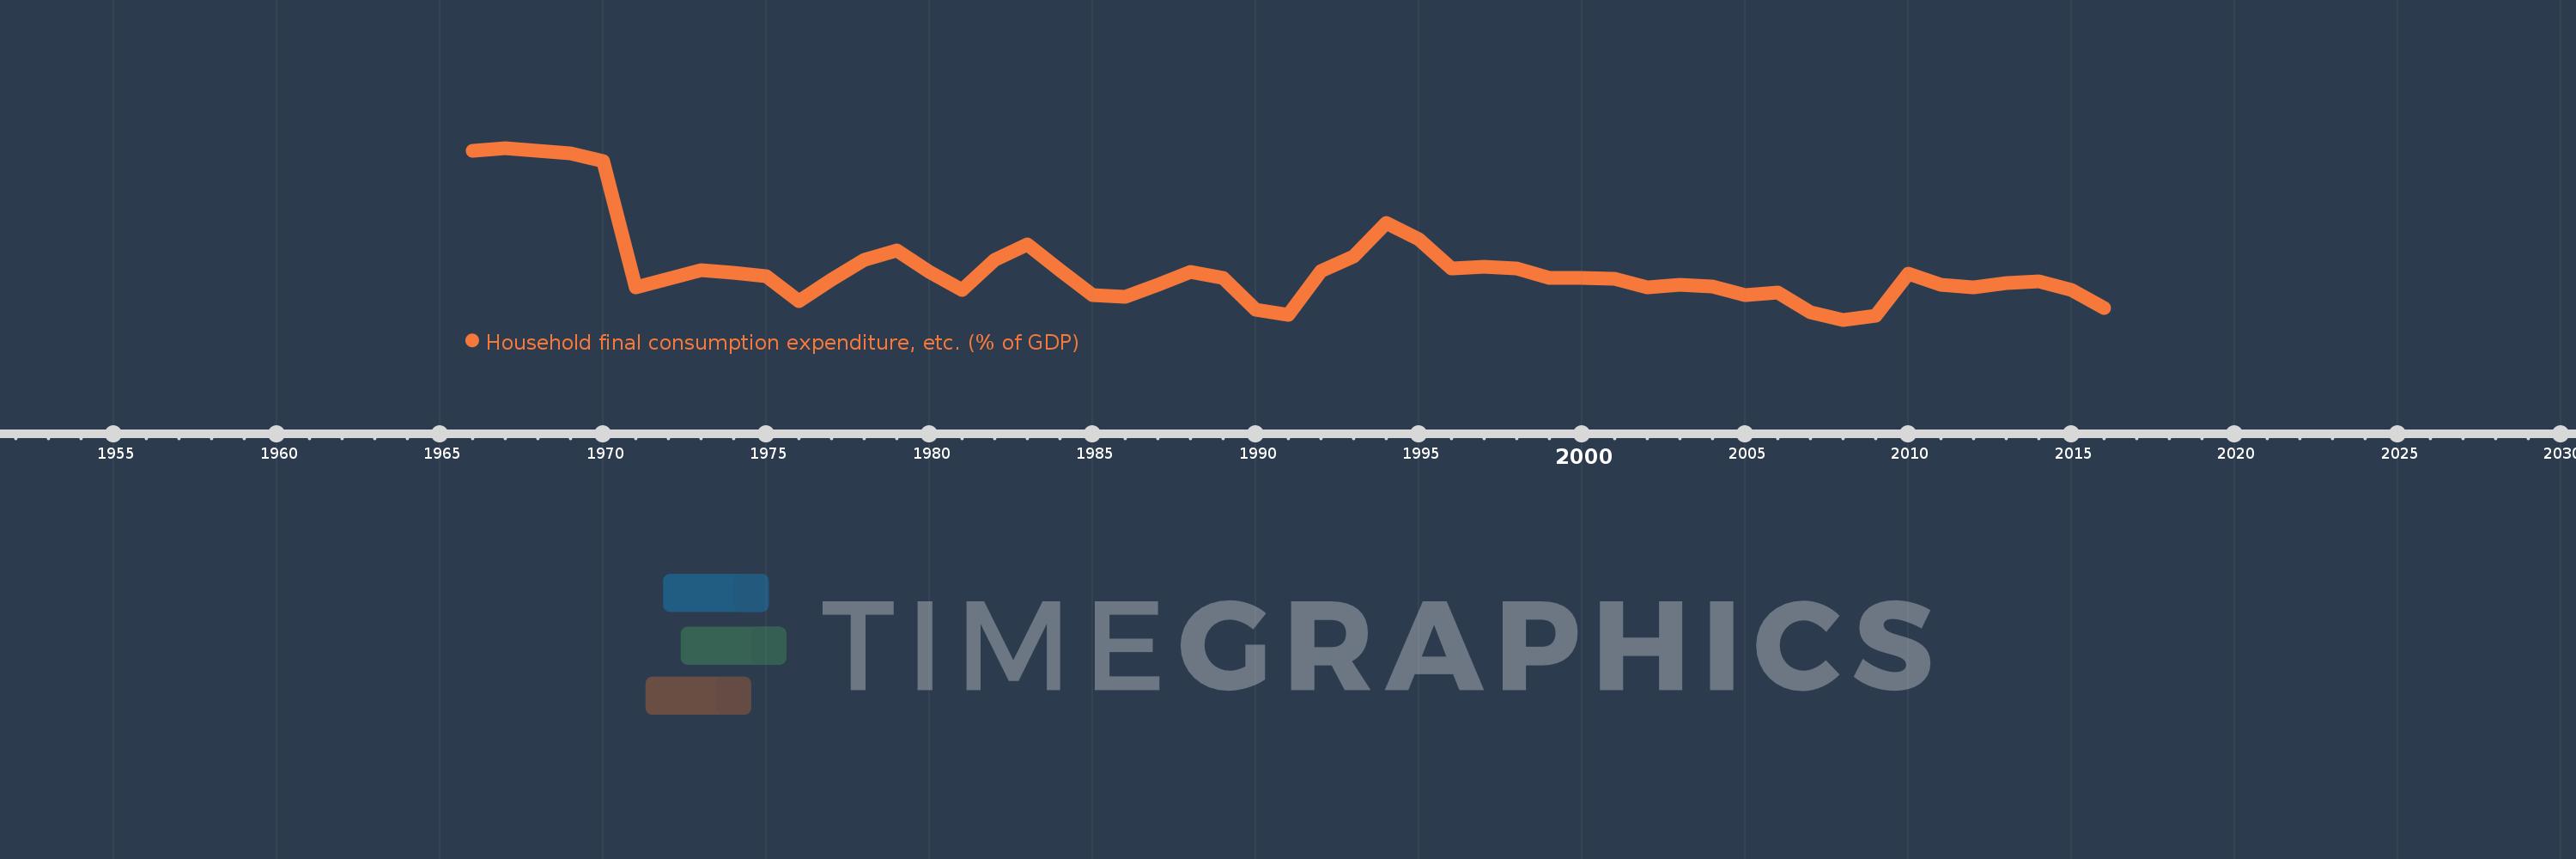
Household final consumption expenditure, etc. (% of GDP)
2016,2015,2014,2013,2012,2011,2010,2009,2008,2007,2006,2005,2004,2003,2002,2001,2000,1999,1998,1997,1996,1995,1994,1993,1992,1991,1990,1989,1988,1987,1986,1985,1984,1983,1982,1981,1980,1979,1978,1977,1976,1975,1974,1973,1972,1971,1970,1969,1968,1967,1966
This statistics in other country:
AfghanistanAlbaniaAlgeriaAngolaAntigua and BarbudaArab WorldArgentinaArmeniaArubaAustraliaAustriaAzerbaijanBahamas, TheBahrainBangladeshBarbadosBelarusBelgiumBelizeBeninBermudaBhutanBoliviaBosnia and HerzegovinaBotswanaBrazilBrunei DarussalamBulgariaBurkina FasoBurundiCabo VerdeCambodiaCameroonCanadaCaribbean small statesCentral African RepublicCentral Europe and the BalticsChadChileChinaColombiaComorosCongo, Dem. Rep.Congo, Rep.Costa RicaCote d'IvoireCroatiaCubaCyprusCzech RepublicDenmarkDjiboutiDominicaDominican RepublicEarly-demographic dividendEast Asia & PacificEast Asia & Pacific (excluding high income)East Asia & Pacific (IDA & IBRD countries)EcuadorEgypt, Arab Rep.El SalvadorEquatorial GuineaEritreaEstoniaEthiopiaEuro areaEurope & Central AsiaEurope & Central Asia (excluding high income)Europe & Central Asia (IDA & IBRD countries)European UnionFaroe IslandsFijiFinlandFragile and conflict affected situationsFranceGabonGambia, TheGeorgiaGermanyGhanaGreeceGrenadaGuatemalaGuineaGuinea-BissauGuyanaHaitiHeavily indebted poor countries (HIPC)High incomeHondurasHong Kong SAR, ChinaHungaryIBRD onlyIcelandIDA & IBRD totalIDA blendIDA onlyIDA totalIndiaIndonesiaIran, Islamic Rep.IraqIrelandIsraelItalyJamaicaJapanJordanKazakhstanKenyaKiribatiKorea, Rep.KosovoKuwaitKyrgyz RepublicLao PDRLate-demographic dividendLatin America & Caribbean Latin America & Caribbean (excluding high income)Latin America & the Caribbean (IDA & IBRD countries)LatviaLeast developed countries: UN classificationLebanonLesothoLiberiaLibyaLithuaniaLow & middle incomeLow incomeLower middle incomeLuxembourgMacao SAR, ChinaMacedonia, FYRMadagascarMalawiMalaysiaMaldivesMaliMaltaMauritaniaMauritiusMexicoMicronesia, Fed. Sts.Middle East & North AfricaMiddle East & North Africa (excluding high income)Middle East & North Africa (IDA & IBRD countries)Middle incomeMoldovaMongoliaMontenegroMoroccoMozambiqueNamibiaNepalNetherlandsNew CaledoniaNew ZealandNicaraguaNigerNigeriaNorth AmericaNorwayOECD membersOmanOther small statesPacific island small statesPakistanPanamaPapua New GuineaParaguayPeruPhilippinesPolandPortugalPost-demographic dividendPre-demographic dividendPuerto RicoQatarRomaniaRussian FederationRwandaSaudi ArabiaSenegalSerbiaSeychellesSierra LeoneSingaporeSlovak RepublicSloveniaSmall statesSolomon IslandsSomaliaSouth AfricaSouth AsiaSouth Asia (IDA & IBRD)South SudanSpainSri LankaSt. Kitts and NevisSt. LuciaSt. Vincent and the GrenadinesSub-Saharan Africa Sub-Saharan Africa (excluding high income)Sub-Saharan Africa (IDA & IBRD countries)SudanSurinameSwazilandSwedenSwitzerlandSyrian Arab RepublicTajikistanTanzaniaThailandTimor-LesteTogoTongaTrinidad and TobagoTunisiaTurkeyTurkmenistanUgandaUkraineUnited Arab EmiratesUnited KingdomUnited StatesUpper middle incomeUruguayUzbekistanVanuatuVenezuela, RBVietnamWest Bank and GazaWorldYemen, Rep.ZambiaZimbabwe Timeline:
This timeline shows a graph from 1966 to 2016 of Sweden. No data until 1965. Number of actual observations by date: 51.
Source name:
World Development Indicators
Source organization:
World Bank national accounts data, and OECD National Accounts data files.
Categories, topics:
Economy & Growth
Last updated:
apr 23, 2017
Indicators value changes by year
Minimum:
44.349
jan 1, 2008
At the date of observation
Value
Absolute change
Change from previous value
jan 1, 1966
54.53
+54.53
0.0%
jan 1, 1967
54.7
+0.17
0.31%
jan 1, 1968
54.511
-0.189
-0.35%
jan 1, 1969
54.398
-0.113
-0.21%
jan 1, 1970
53.884
-0.514
-0.95%
jan 1, 1971
46.284
-7.6
-14.1%
jan 1, 1972
46.829
+0.545
1.18%
jan 1, 1973
47.35
+0.521
1.11%
jan 1, 1974
47.165
-0.185
-0.39%
jan 1, 1975
46.982
-0.182
-0.39%
jan 1, 1976
45.486
-1.496
-3.18%
jan 1, 1977
46.742
+1.255
2.76%
jan 1, 1978
47.97
+1.228
2.63%
jan 1, 1979
48.509
+0.54
1.13%
jan 1, 1980
47.212
-1.297
-2.67%
jan 1, 1981
46.163
-1.049
-2.22%
jan 1, 1982
47.971
+1.809
3.92%
jan 1, 1983
48.877
+0.906
1.89%
jan 1, 1984
47.332
-1.545
-3.16%
jan 1, 1985
45.846
-1.487
-3.14%
jan 1, 1986
45.711
-0.135
-0.29%
jan 1, 1987
46.447
+0.736
1.61%
jan 1, 1988
47.215
+0.768
1.65%
jan 1, 1989
46.852
-0.363
-0.77%
jan 1, 1990
44.968
-1.884
-4.02%
jan 1, 1991
44.637
-0.331
-0.74%
jan 1, 1992
47.271
+2.634
5.9%
jan 1, 1993
48.169
+0.898
1.9%
jan 1, 1994
50.186
+2.017
4.19%
jan 1, 1995
49.224
-0.963
-1.92%
jan 1, 1996
47.447
-1.776
-3.61%
jan 1, 1997
47.527
+0.079
0.17%
jan 1, 1998
47.424
-0.103
-0.22%
jan 1, 1999
46.851
-0.573
-1.21%
jan 1, 2000
46.877
+0.025
0.05%
jan 1, 2001
46.84
-0.037
-0.08%
jan 1, 2002
46.296
-0.544
-1.16%
jan 1, 2003
46.468
+0.172
0.37%
jan 1, 2004
46.373
-0.095
-0.2%
jan 1, 2005
45.852
-0.522
-1.13%
jan 1, 2006
45.968
+0.116
0.25%
jan 1, 2007
44.809
-1.159
-2.52%
jan 1, 2008
44.349
-0.46
-1.03%
jan 1, 2009
44.613
+0.264
0.59%
jan 1, 2010
47.146
+2.533
5.68%
jan 1, 2011
46.439
-0.707
-1.5%
jan 1, 2012
46.297
-0.141
-0.3%
jan 1, 2013
46.543
+0.246
0.53%
jan 1, 2014
46.667
+0.124
0.27%
jan 1, 2015
46.133
-0.534
-1.14%
jan 1, 2016
45.07
-1.063
-2.3%
Ranking of countries by current statistics by years


Comments: