29
/
en
AIzaSyAYiBZKx7MnpbEhh9jyipgxe19OcubqV5w
April 1, 2024
35036
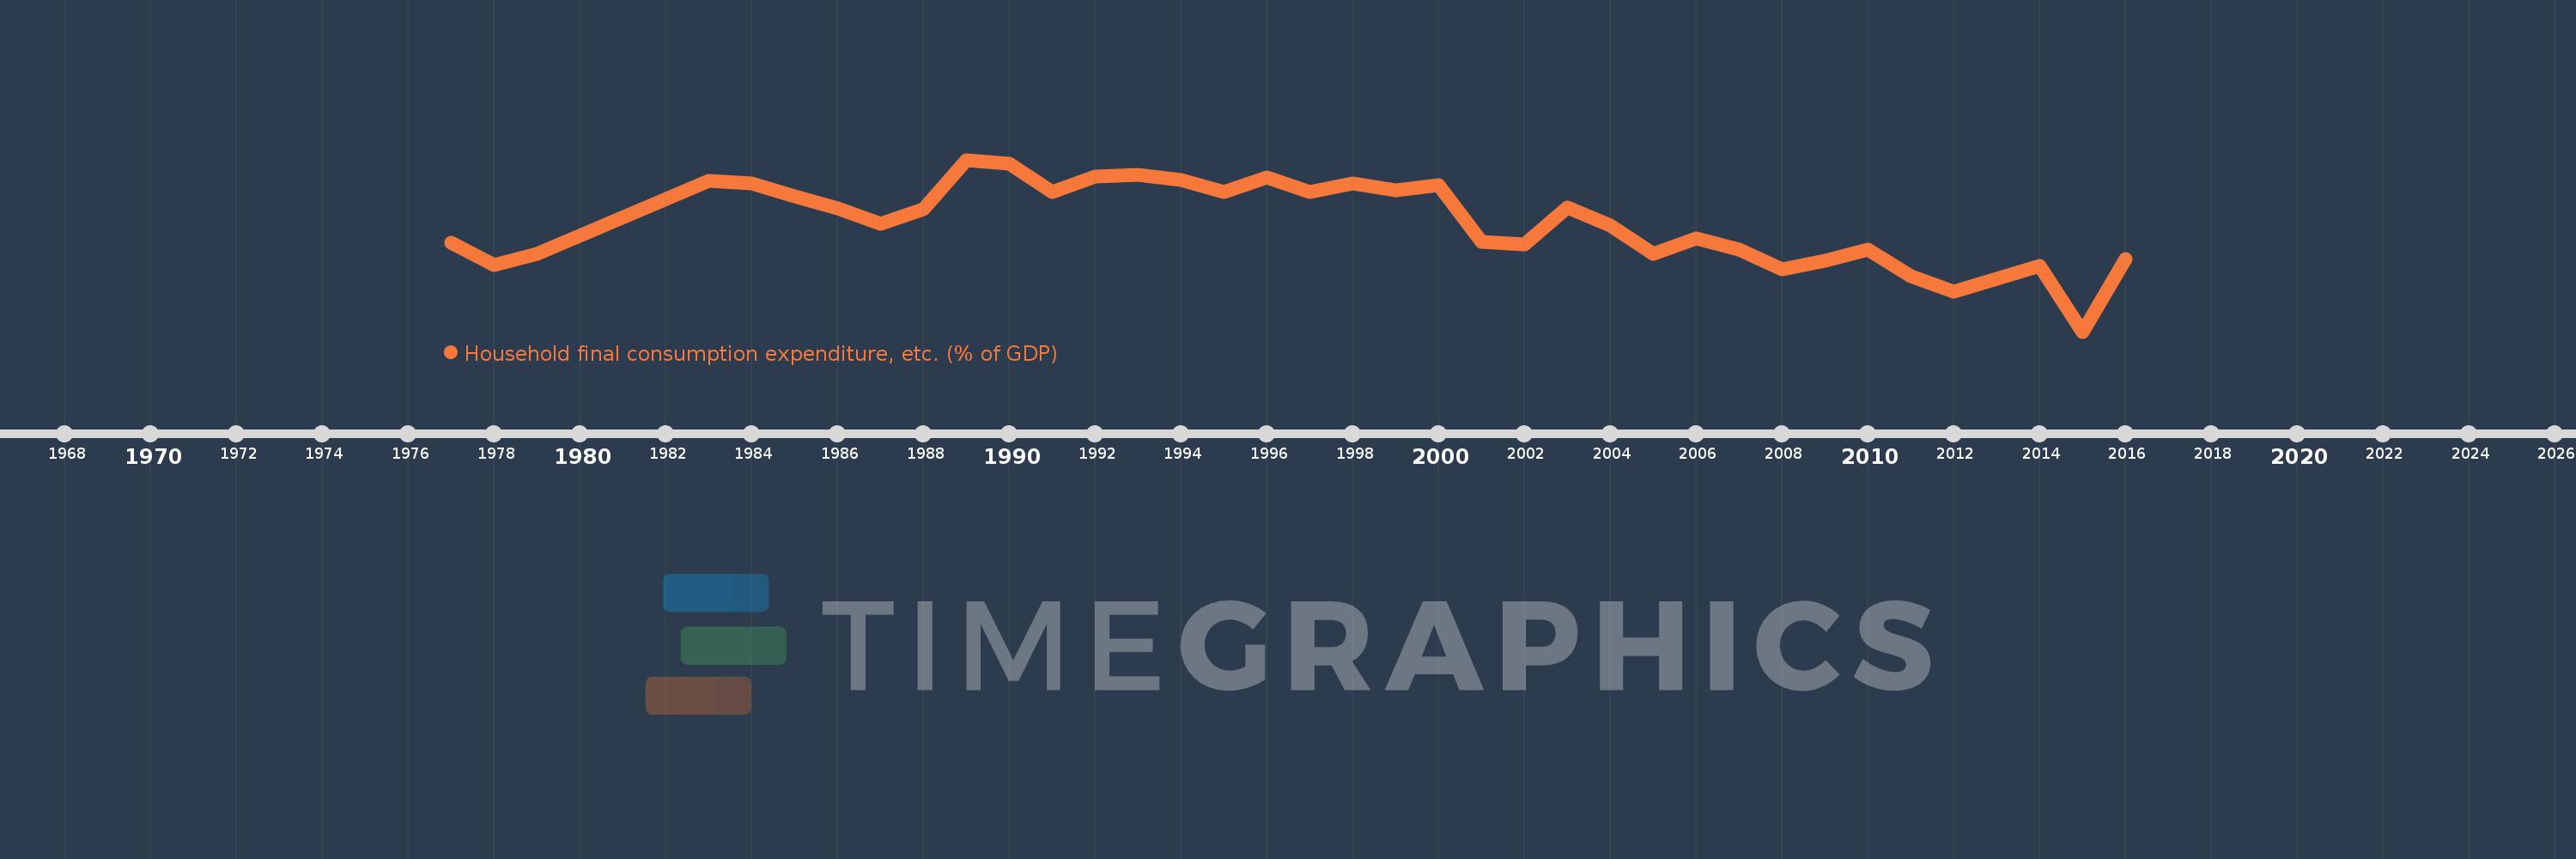
Heavily indebted poor countries (HIPC)
HPC
false
2
1
Household final consumption expenditure, etc. (% of GDP)
2016,2015,2014,2013,2012,2011,2010,2009,2008,2007,2006,2005,2004,2003,2002,2001,2000,1999,1998,1997,1996,1995,1994,1993,1992,1991,1990,1989,1988,1987,1986,1985,1984,1983,1979,1978,1977
This statistics in other country:
AfghanistanAlbaniaAlgeriaAngolaAntigua and BarbudaArab WorldArgentinaArmeniaArubaAustraliaAustriaAzerbaijanBahamas, TheBahrainBangladeshBarbadosBelarusBelgiumBelizeBeninBermudaBhutanBoliviaBosnia and HerzegovinaBotswanaBrazilBrunei DarussalamBulgariaBurkina FasoBurundiCabo VerdeCambodiaCameroonCanadaCaribbean small statesCentral African RepublicCentral Europe and the BalticsChadChileChinaColombiaComorosCongo, Dem. Rep.Congo, Rep.Costa RicaCote d'IvoireCroatiaCubaCyprusCzech RepublicDenmarkDjiboutiDominicaDominican RepublicEarly-demographic dividendEast Asia & PacificEast Asia & Pacific (excluding high income)East Asia & Pacific (IDA & IBRD countries)EcuadorEgypt, Arab Rep.El SalvadorEquatorial GuineaEritreaEstoniaEthiopiaEuro areaEurope & Central AsiaEurope & Central Asia (excluding high income)Europe & Central Asia (IDA & IBRD countries)European UnionFaroe IslandsFijiFinlandFragile and conflict affected situationsFranceGabonGambia, TheGeorgiaGermanyGhanaGreeceGrenadaGuatemalaGuineaGuinea-BissauGuyanaHaitiHeavily indebted poor countries (HIPC)High incomeHondurasHong Kong SAR, ChinaHungaryIBRD onlyIcelandIDA & IBRD totalIDA blendIDA onlyIDA totalIndiaIndonesiaIran, Islamic Rep.IraqIrelandIsraelItalyJamaicaJapanJordanKazakhstanKenyaKiribatiKorea, Rep.KosovoKuwaitKyrgyz RepublicLao PDRLate-demographic dividendLatin America & Caribbean Latin America & Caribbean (excluding high income)Latin America & the Caribbean (IDA & IBRD countries)LatviaLeast developed countries: UN classificationLebanonLesothoLiberiaLibyaLithuaniaLow & middle incomeLow incomeLower middle incomeLuxembourgMacao SAR, ChinaMacedonia, FYRMadagascarMalawiMalaysiaMaldivesMaliMaltaMauritaniaMauritiusMexicoMicronesia, Fed. Sts.Middle East & North AfricaMiddle East & North Africa (excluding high income)Middle East & North Africa (IDA & IBRD countries)Middle incomeMoldovaMongoliaMontenegroMoroccoMozambiqueNamibiaNepalNetherlandsNew CaledoniaNew ZealandNicaraguaNigerNigeriaNorth AmericaNorwayOECD membersOmanOther small statesPacific island small statesPakistanPanamaPapua New GuineaParaguayPeruPhilippinesPolandPortugalPost-demographic dividendPre-demographic dividendPuerto RicoQatarRomaniaRussian FederationRwandaSaudi ArabiaSenegalSerbiaSeychellesSierra LeoneSingaporeSlovak RepublicSloveniaSmall statesSolomon IslandsSomaliaSouth AfricaSouth AsiaSouth Asia (IDA & IBRD)South SudanSpainSri LankaSt. Kitts and NevisSt. LuciaSt. Vincent and the GrenadinesSub-Saharan Africa Sub-Saharan Africa (excluding high income)Sub-Saharan Africa (IDA & IBRD countries)SudanSurinameSwazilandSwedenSwitzerlandSyrian Arab RepublicTajikistanTanzaniaThailandTimor-LesteTogoTongaTrinidad and TobagoTunisiaTurkeyTurkmenistanUgandaUkraineUnited Arab EmiratesUnited KingdomUnited StatesUpper middle incomeUruguayUzbekistanVanuatuVenezuela, RBVietnamWest Bank and GazaWorldYemen, Rep.ZambiaZimbabwe Timeline:
This timeline shows a graph from 1977 to 2016 of Heavily indebted poor countries (HIPC). No data until 1976. Number of actual observations by date: 37.
Source name:
World Development Indicators
Source organization:
World Bank national accounts data, and OECD National Accounts data files.
Categories, topics:
Economy & Growth
Last updated:
apr 23, 2017
Indicators value changes by year
Minimum:
69.633
jan 1, 2015
Maximum:
80.579
jan 1, 1989
At the date of observation
Value
Absolute change
Change from previous value
jan 1, 1977
75.297
+75.297
0.0%
jan 1, 1978
73.875
-1.422
-1.89%
jan 1, 1979
74.561
+0.686
0.93%
jan 1, 1983
79.261
+4.7
6.3%
jan 1, 1984
79.067
-0.194
-0.24%
jan 1, 1985
78.247
-0.82
-1.04%
jan 1, 1986
77.513
-0.734
-0.94%
jan 1, 1987
76.523
-0.989
-1.28%
jan 1, 1988
77.448
+0.925
1.21%
jan 1, 1989
80.579
+3.131
4.04%
jan 1, 1990
80.32
-0.26
-0.32%
jan 1, 1991
78.525
-1.794
-2.23%
jan 1, 1992
79.485
+0.959
1.22%
jan 1, 1993
79.601
+0.116
0.15%
jan 1, 1994
79.31
-0.291
-0.37%
jan 1, 1995
78.532
-0.777
-0.98%
jan 1, 1996
79.45
+0.918
1.17%
jan 1, 1997
78.527
-0.923
-1.16%
jan 1, 1998
79.051
+0.523
0.67%
jan 1, 1999
78.65
-0.401
-0.51%
jan 1, 2000
78.988
+0.338
0.43%
jan 1, 2001
75.351
-3.637
-4.6%
jan 1, 2002
75.163
-0.188
-0.25%
jan 1, 2003
77.568
+2.405
3.2%
jan 1, 2004
76.414
-1.153
-1.49%
jan 1, 2005
74.571
-1.843
-2.41%
jan 1, 2006
75.591
+1.019
1.37%
jan 1, 2007
74.871
-0.719
-0.95%
jan 1, 2008
73.614
-1.257
-1.68%
jan 1, 2009
74.129
+0.515
0.7%
jan 1, 2010
74.884
+0.755
1.02%
jan 1, 2011
73.16
-1.724
-2.3%
jan 1, 2012
72.152
-1.008
-1.38%
jan 1, 2013
73.015
+0.863
1.2%
jan 1, 2014
73.8
+0.785
1.07%
jan 1, 2015
69.633
-4.167
-5.65%
jan 1, 2016
74.275
+4.642
6.67%
Ranking of countries by current statistics by years


Comments: