29
/
en
AIzaSyAYiBZKx7MnpbEhh9jyipgxe19OcubqV5w
April 1, 2024
64813
Albania
ALB
true
2
1
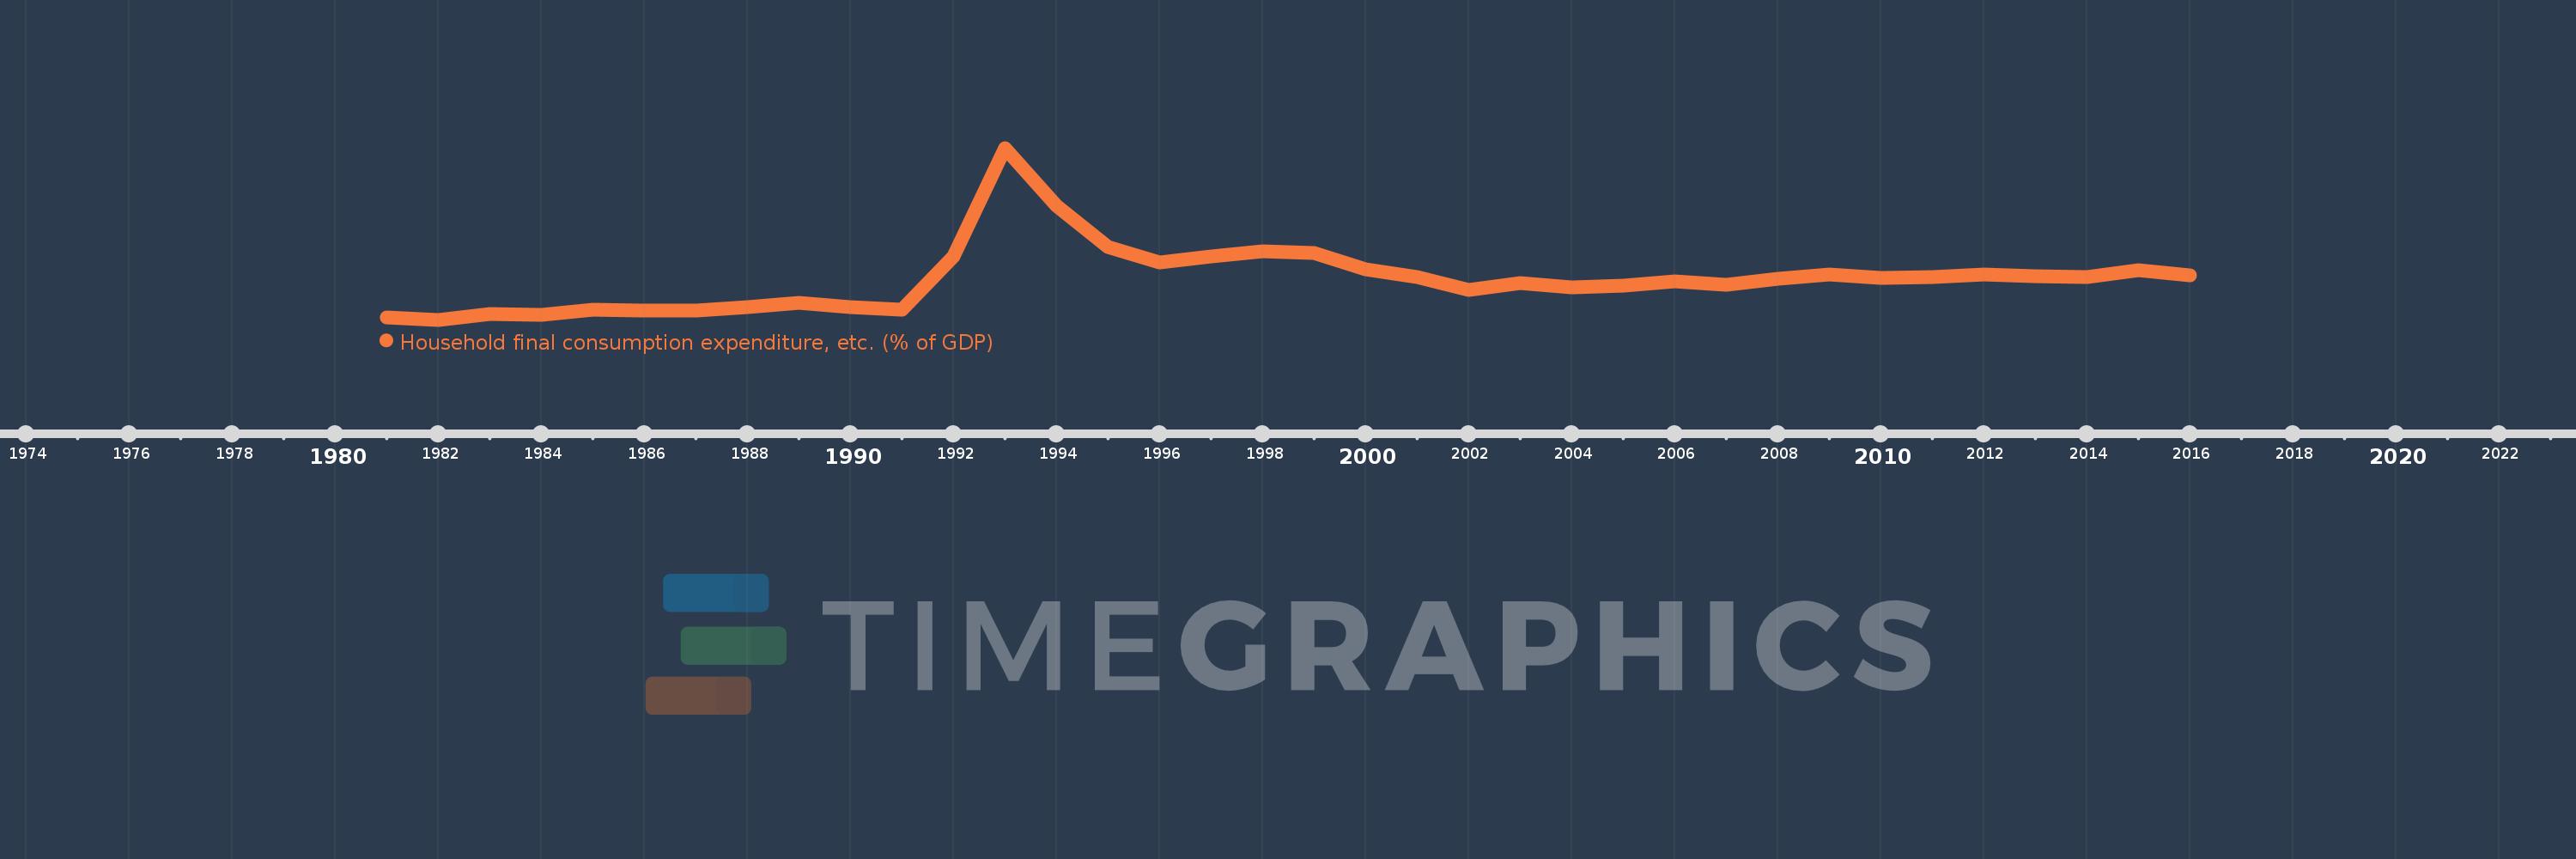
Household final consumption expenditure, etc. (% of GDP)
2016,2015,2014,2013,2012,2011,2010,2009,2008,2007,2006,2005,2004,2003,2002,2001,2000,1999,1998,1997,1996,1995,1994,1993,1992,1991,1990,1989,1988,1987,1986,1985,1984,1983,1982,1981
This statistics in other country:
AfghanistanAlbaniaAlgeriaAngolaAntigua and BarbudaArab WorldArgentinaArmeniaArubaAustraliaAustriaAzerbaijanBahamas, TheBahrainBangladeshBarbadosBelarusBelgiumBelizeBeninBermudaBhutanBoliviaBosnia and HerzegovinaBotswanaBrazilBrunei DarussalamBulgariaBurkina FasoBurundiCabo VerdeCambodiaCameroonCanadaCaribbean small statesCentral African RepublicCentral Europe and the BalticsChadChileChinaColombiaComorosCongo, Dem. Rep.Congo, Rep.Costa RicaCote d'IvoireCroatiaCubaCyprusCzech RepublicDenmarkDjiboutiDominicaDominican RepublicEarly-demographic dividendEast Asia & PacificEast Asia & Pacific (excluding high income)East Asia & Pacific (IDA & IBRD countries)EcuadorEgypt, Arab Rep.El SalvadorEquatorial GuineaEritreaEstoniaEthiopiaEuro areaEurope & Central AsiaEurope & Central Asia (excluding high income)Europe & Central Asia (IDA & IBRD countries)European UnionFaroe IslandsFijiFinlandFragile and conflict affected situationsFranceGabonGambia, TheGeorgiaGermanyGhanaGreeceGrenadaGuatemalaGuineaGuinea-BissauGuyanaHaitiHeavily indebted poor countries (HIPC)High incomeHondurasHong Kong SAR, ChinaHungaryIBRD onlyIcelandIDA & IBRD totalIDA blendIDA onlyIDA totalIndiaIndonesiaIran, Islamic Rep.IraqIrelandIsraelItalyJamaicaJapanJordanKazakhstanKenyaKiribatiKorea, Rep.KosovoKuwaitKyrgyz RepublicLao PDRLate-demographic dividendLatin America & Caribbean Latin America & Caribbean (excluding high income)Latin America & the Caribbean (IDA & IBRD countries)LatviaLeast developed countries: UN classificationLebanonLesothoLiberiaLibyaLithuaniaLow & middle incomeLow incomeLower middle incomeLuxembourgMacao SAR, ChinaMacedonia, FYRMadagascarMalawiMalaysiaMaldivesMaliMaltaMauritaniaMauritiusMexicoMicronesia, Fed. Sts.Middle East & North AfricaMiddle East & North Africa (excluding high income)Middle East & North Africa (IDA & IBRD countries)Middle incomeMoldovaMongoliaMontenegroMoroccoMozambiqueNamibiaNepalNetherlandsNew CaledoniaNew ZealandNicaraguaNigerNigeriaNorth AmericaNorwayOECD membersOmanOther small statesPacific island small statesPakistanPanamaPapua New GuineaParaguayPeruPhilippinesPolandPortugalPost-demographic dividendPre-demographic dividendPuerto RicoQatarRomaniaRussian FederationRwandaSaudi ArabiaSenegalSerbiaSeychellesSierra LeoneSingaporeSlovak RepublicSloveniaSmall statesSolomon IslandsSomaliaSouth AfricaSouth AsiaSouth Asia (IDA & IBRD)South SudanSpainSri LankaSt. Kitts and NevisSt. LuciaSt. Vincent and the GrenadinesSub-Saharan Africa Sub-Saharan Africa (excluding high income)Sub-Saharan Africa (IDA & IBRD countries)SudanSurinameSwazilandSwedenSwitzerlandSyrian Arab RepublicTajikistanTanzaniaThailandTimor-LesteTogoTongaTrinidad and TobagoTunisiaTurkeyTurkmenistanUgandaUkraineUnited Arab EmiratesUnited KingdomUnited StatesUpper middle incomeUruguayUzbekistanVanuatuVenezuela, RBVietnamWest Bank and GazaWorldYemen, Rep.ZambiaZimbabwe Timeline:
This timeline shows a graph from 1981 to 2016 of Albania. No data until 1980. Number of actual observations by date: 36.
Source name:
World Development Indicators
Source organization:
World Bank national accounts data, and OECD National Accounts data files.
Categories, topics:
Economy & Growth
Last updated:
apr 23, 2017
Indicators value changes by year
Minimum:
54.875
jan 1, 1982
Maximum:
152.142
jan 1, 1993
At the date of observation
Value
Absolute change
Change from previous value
jan 1, 1981
56.062
+56.062
0.0%
jan 1, 1982
54.875
-1.187
-2.12%
jan 1, 1983
57.996
+3.121
5.69%
jan 1, 1984
57.761
-0.236
-0.41%
jan 1, 1985
60.771
+3.01
5.21%
jan 1, 1986
60.158
-0.613
-1.01%
jan 1, 1987
60.226
+0.068
0.11%
jan 1, 1988
62.033
+1.807
3.0%
jan 1, 1989
64.471
+2.438
3.93%
jan 1, 1990
62.245
-2.226
-3.45%
jan 1, 1991
60.5
-1.745
-2.8%
jan 1, 1992
90.948
+30.448
50.33%
jan 1, 1993
152.142
+61.193
67.28%
jan 1, 1994
119.541
-32.601
-21.43%
jan 1, 1995
95.846
-23.695
-19.82%
jan 1, 1996
87.391
-8.456
-8.82%
jan 1, 1997
90.479
+3.089
3.53%
jan 1, 1998
93.795
+3.316
3.66%
jan 1, 1999
92.509
-1.287
-1.37%
jan 1, 2000
83.439
-9.07
-9.8%
jan 1, 2001
78.997
-4.442
-5.32%
jan 1, 2002
71.808
-7.189
-9.1%
jan 1, 2003
75.662
+3.854
5.37%
jan 1, 2004
73.366
-2.296
-3.03%
jan 1, 2005
74.209
+0.843
1.15%
jan 1, 2006
76.799
+2.59
3.49%
jan 1, 2007
74.472
-2.327
-3.03%
jan 1, 2008
77.885
+3.412
4.58%
jan 1, 2009
80.69
+2.805
3.6%
jan 1, 2010
78.491
-2.199
-2.73%
jan 1, 2011
79.118
+0.628
0.8%
jan 1, 2012
80.348
+1.229
1.55%
jan 1, 2013
79.462
-0.886
-1.1%
jan 1, 2014
78.803
-0.658
-0.83%
jan 1, 2015
82.944
+4.14
5.25%
jan 1, 2016
80.123
-2.821
-3.4%
Ranking of countries by current statistics by years


Comments: