29
/
en
AIzaSyAYiBZKx7MnpbEhh9jyipgxe19OcubqV5w
April 1, 2024
76262
Bahamas, The
BHS
true
2
1
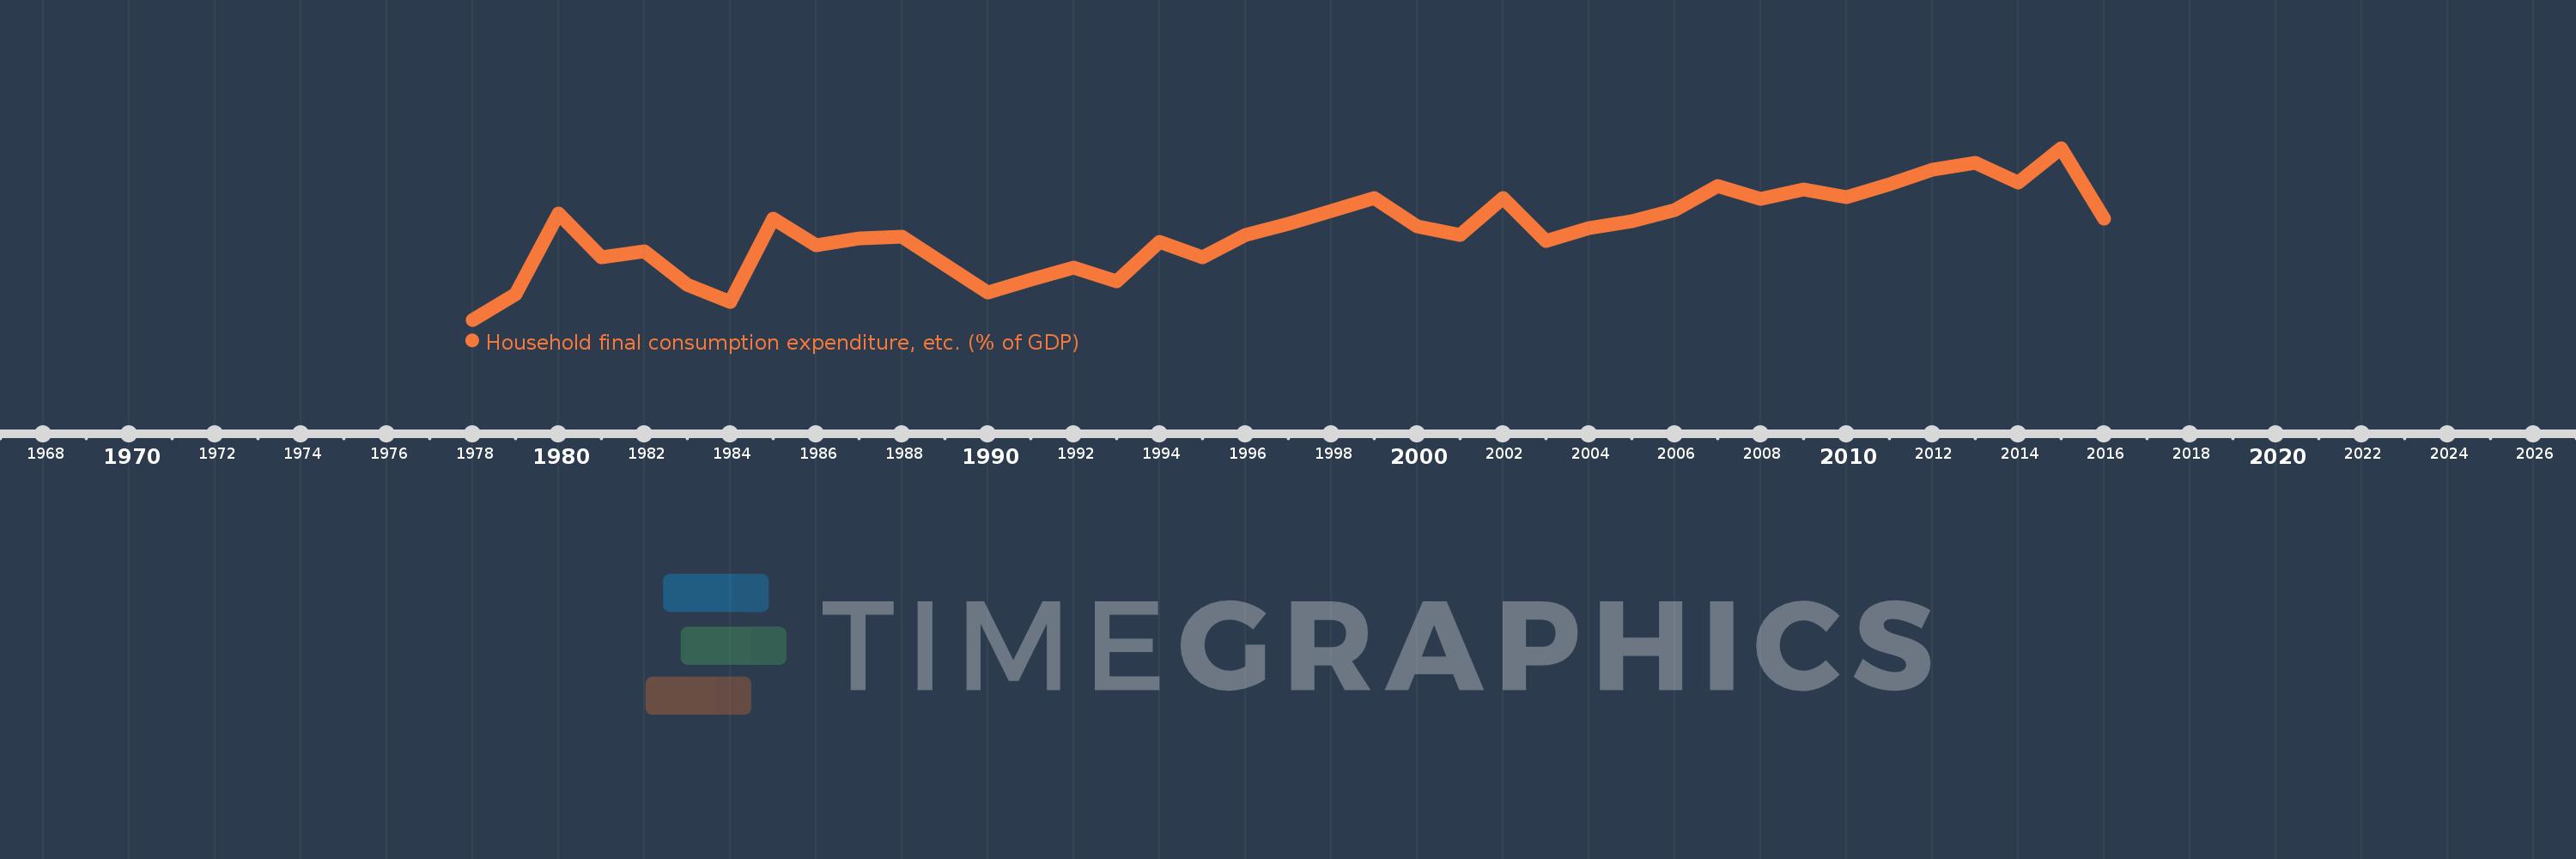
Household final consumption expenditure, etc. (% of GDP)
2016,2015,2014,2013,2012,2011,2010,2009,2008,2007,2006,2005,2004,2003,2002,2001,2000,1999,1998,1997,1996,1995,1994,1993,1992,1991,1990,1988,1987,1986,1985,1984,1983,1982,1981,1980,1979,1978
This statistics in other country:
AfghanistanAlbaniaAlgeriaAngolaAntigua and BarbudaArab WorldArgentinaArmeniaArubaAustraliaAustriaAzerbaijanBahamas, TheBahrainBangladeshBarbadosBelarusBelgiumBelizeBeninBermudaBhutanBoliviaBosnia and HerzegovinaBotswanaBrazilBrunei DarussalamBulgariaBurkina FasoBurundiCabo VerdeCambodiaCameroonCanadaCaribbean small statesCentral African RepublicCentral Europe and the BalticsChadChileChinaColombiaComorosCongo, Dem. Rep.Congo, Rep.Costa RicaCote d'IvoireCroatiaCubaCyprusCzech RepublicDenmarkDjiboutiDominicaDominican RepublicEarly-demographic dividendEast Asia & PacificEast Asia & Pacific (excluding high income)East Asia & Pacific (IDA & IBRD countries)EcuadorEgypt, Arab Rep.El SalvadorEquatorial GuineaEritreaEstoniaEthiopiaEuro areaEurope & Central AsiaEurope & Central Asia (excluding high income)Europe & Central Asia (IDA & IBRD countries)European UnionFaroe IslandsFijiFinlandFragile and conflict affected situationsFranceGabonGambia, TheGeorgiaGermanyGhanaGreeceGrenadaGuatemalaGuineaGuinea-BissauGuyanaHaitiHeavily indebted poor countries (HIPC)High incomeHondurasHong Kong SAR, ChinaHungaryIBRD onlyIcelandIDA & IBRD totalIDA blendIDA onlyIDA totalIndiaIndonesiaIran, Islamic Rep.IraqIrelandIsraelItalyJamaicaJapanJordanKazakhstanKenyaKiribatiKorea, Rep.KosovoKuwaitKyrgyz RepublicLao PDRLate-demographic dividendLatin America & Caribbean Latin America & Caribbean (excluding high income)Latin America & the Caribbean (IDA & IBRD countries)LatviaLeast developed countries: UN classificationLebanonLesothoLiberiaLibyaLithuaniaLow & middle incomeLow incomeLower middle incomeLuxembourgMacao SAR, ChinaMacedonia, FYRMadagascarMalawiMalaysiaMaldivesMaliMaltaMauritaniaMauritiusMexicoMicronesia, Fed. Sts.Middle East & North AfricaMiddle East & North Africa (excluding high income)Middle East & North Africa (IDA & IBRD countries)Middle incomeMoldovaMongoliaMontenegroMoroccoMozambiqueNamibiaNepalNetherlandsNew CaledoniaNew ZealandNicaraguaNigerNigeriaNorth AmericaNorwayOECD membersOmanOther small statesPacific island small statesPakistanPanamaPapua New GuineaParaguayPeruPhilippinesPolandPortugalPost-demographic dividendPre-demographic dividendPuerto RicoQatarRomaniaRussian FederationRwandaSaudi ArabiaSenegalSerbiaSeychellesSierra LeoneSingaporeSlovak RepublicSloveniaSmall statesSolomon IslandsSomaliaSouth AfricaSouth AsiaSouth Asia (IDA & IBRD)South SudanSpainSri LankaSt. Kitts and NevisSt. LuciaSt. Vincent and the GrenadinesSub-Saharan Africa Sub-Saharan Africa (excluding high income)Sub-Saharan Africa (IDA & IBRD countries)SudanSurinameSwazilandSwedenSwitzerlandSyrian Arab RepublicTajikistanTanzaniaThailandTimor-LesteTogoTongaTrinidad and TobagoTunisiaTurkeyTurkmenistanUgandaUkraineUnited Arab EmiratesUnited KingdomUnited StatesUpper middle incomeUruguayUzbekistanVanuatuVenezuela, RBVietnamWest Bank and GazaWorldYemen, Rep.ZambiaZimbabwe Timeline:
This timeline shows a graph from 1978 to 2016 of Bahamas, The. No data until 1977. Number of actual observations by date: 38.
Source name:
World Development Indicators
Source organization:
World Bank national accounts data, and OECD National Accounts data files.
Categories, topics:
Economy & Growth
Last updated:
apr 23, 2017
Indicators value changes by year
Minimum:
55.652
jan 1, 1978
Maximum:
72.264
jan 1, 2015
At the date of observation
Value
Absolute change
Change from previous value
jan 1, 1978
55.652
+55.652
0.0%
jan 1, 1979
58.085
+2.433
4.37%
jan 1, 1980
65.889
+7.804
13.43%
jan 1, 1981
61.701
-4.187
-6.36%
jan 1, 1982
62.313
+0.612
0.99%
jan 1, 1983
59.064
-3.25
-5.22%
jan 1, 1984
57.381
-1.682
-2.85%
jan 1, 1985
65.435
+8.054
14.04%
jan 1, 1986
62.852
-2.584
-3.95%
jan 1, 1987
63.527
+0.675
1.07%
jan 1, 1988
63.659
+0.132
0.21%
jan 1, 1990
58.276
-5.383
-8.46%
jan 1, 1991
59.525
+1.249
2.14%
jan 1, 1992
60.698
+1.174
1.97%
jan 1, 1993
59.363
-1.335
-2.2%
jan 1, 1994
63.215
+3.852
6.49%
jan 1, 1995
61.688
-1.528
-2.42%
jan 1, 1996
63.825
+2.137
3.46%
jan 1, 1997
64.966
+1.141
1.79%
jan 1, 1998
66.136
+1.17
1.8%
jan 1, 1999
67.45
+1.314
1.99%
jan 1, 2000
64.642
-2.808
-4.16%
jan 1, 2001
63.836
-0.806
-1.25%
jan 1, 2002
67.458
+3.622
5.67%
jan 1, 2003
63.235
-4.223
-6.26%
jan 1, 2004
64.522
+1.287
2.04%
jan 1, 2005
65.166
+0.644
1.0%
jan 1, 2006
66.219
+1.053
1.62%
jan 1, 2007
68.562
+2.343
3.54%
jan 1, 2008
67.318
-1.244
-1.81%
jan 1, 2009
68.251
+0.933
1.39%
jan 1, 2010
67.514
-0.737
-1.08%
jan 1, 2011
68.73
+1.217
1.8%
jan 1, 2012
70.163
+1.433
2.08%
jan 1, 2013
70.829
+0.666
0.95%
jan 1, 2014
68.946
-1.883
-2.66%
jan 1, 2015
72.264
+3.318
4.81%
jan 1, 2016
65.388
-6.877
-9.52%
Ranking of countries by current statistics by years


Comments: