29
/
en
AIzaSyAYiBZKx7MnpbEhh9jyipgxe19OcubqV5w
April 1, 2024
276745
United States
USA
true
2
1
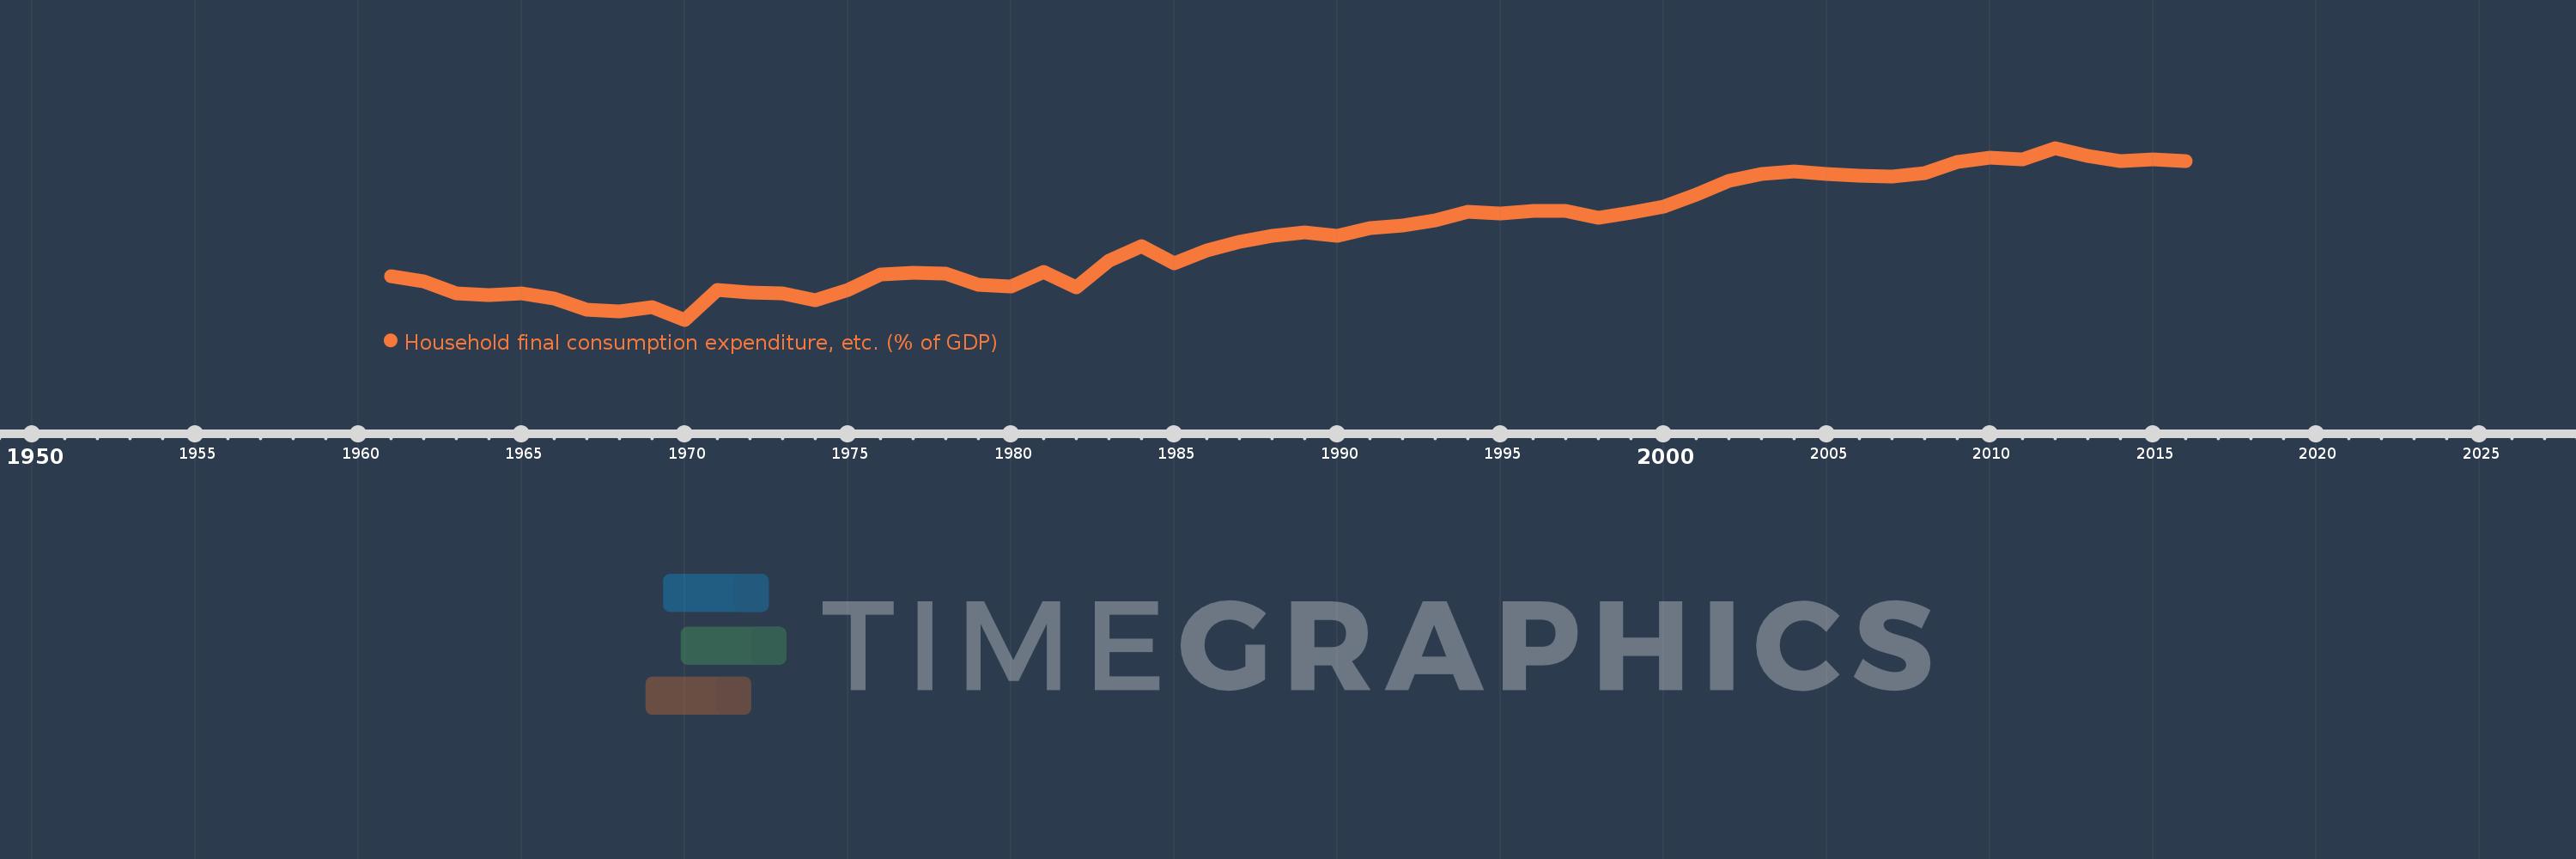
Household final consumption expenditure, etc. (% of GDP)
2016,2015,2014,2013,2012,2011,2010,2009,2008,2007,2006,2005,2004,2003,2002,2001,2000,1999,1998,1997,1996,1995,1994,1993,1992,1991,1990,1989,1988,1987,1986,1985,1984,1983,1982,1981,1980,1979,1978,1977,1976,1975,1974,1973,1972,1971,1970,1969,1968,1967,1966,1965,1964,1963,1962,1961
This statistics in other country:
AfghanistanAlbaniaAlgeriaAngolaAntigua and BarbudaArab WorldArgentinaArmeniaArubaAustraliaAustriaAzerbaijanBahamas, TheBahrainBangladeshBarbadosBelarusBelgiumBelizeBeninBermudaBhutanBoliviaBosnia and HerzegovinaBotswanaBrazilBrunei DarussalamBulgariaBurkina FasoBurundiCabo VerdeCambodiaCameroonCanadaCaribbean small statesCentral African RepublicCentral Europe and the BalticsChadChileChinaColombiaComorosCongo, Dem. Rep.Congo, Rep.Costa RicaCote d'IvoireCroatiaCubaCyprusCzech RepublicDenmarkDjiboutiDominicaDominican RepublicEarly-demographic dividendEast Asia & PacificEast Asia & Pacific (excluding high income)East Asia & Pacific (IDA & IBRD countries)EcuadorEgypt, Arab Rep.El SalvadorEquatorial GuineaEritreaEstoniaEthiopiaEuro areaEurope & Central AsiaEurope & Central Asia (excluding high income)Europe & Central Asia (IDA & IBRD countries)European UnionFaroe IslandsFijiFinlandFragile and conflict affected situationsFranceGabonGambia, TheGeorgiaGermanyGhanaGreeceGrenadaGuatemalaGuineaGuinea-BissauGuyanaHaitiHeavily indebted poor countries (HIPC)High incomeHondurasHong Kong SAR, ChinaHungaryIBRD onlyIcelandIDA & IBRD totalIDA blendIDA onlyIDA totalIndiaIndonesiaIran, Islamic Rep.IraqIrelandIsraelItalyJamaicaJapanJordanKazakhstanKenyaKiribatiKorea, Rep.KosovoKuwaitKyrgyz RepublicLao PDRLate-demographic dividendLatin America & Caribbean Latin America & Caribbean (excluding high income)Latin America & the Caribbean (IDA & IBRD countries)LatviaLeast developed countries: UN classificationLebanonLesothoLiberiaLibyaLithuaniaLow & middle incomeLow incomeLower middle incomeLuxembourgMacao SAR, ChinaMacedonia, FYRMadagascarMalawiMalaysiaMaldivesMaliMaltaMauritaniaMauritiusMexicoMicronesia, Fed. Sts.Middle East & North AfricaMiddle East & North Africa (excluding high income)Middle East & North Africa (IDA & IBRD countries)Middle incomeMoldovaMongoliaMontenegroMoroccoMozambiqueNamibiaNepalNetherlandsNew CaledoniaNew ZealandNicaraguaNigerNigeriaNorth AmericaNorwayOECD membersOmanOther small statesPacific island small statesPakistanPanamaPapua New GuineaParaguayPeruPhilippinesPolandPortugalPost-demographic dividendPre-demographic dividendPuerto RicoQatarRomaniaRussian FederationRwandaSaudi ArabiaSenegalSerbiaSeychellesSierra LeoneSingaporeSlovak RepublicSloveniaSmall statesSolomon IslandsSomaliaSouth AfricaSouth AsiaSouth Asia (IDA & IBRD)South SudanSpainSri LankaSt. Kitts and NevisSt. LuciaSt. Vincent and the GrenadinesSub-Saharan Africa Sub-Saharan Africa (excluding high income)Sub-Saharan Africa (IDA & IBRD countries)SudanSurinameSwazilandSwedenSwitzerlandSyrian Arab RepublicTajikistanTanzaniaThailandTimor-LesteTogoTongaTrinidad and TobagoTunisiaTurkeyTurkmenistanUgandaUkraineUnited Arab EmiratesUnited KingdomUnited StatesUpper middle incomeUruguayUzbekistanVanuatuVenezuela, RBVietnamWest Bank and GazaWorldYemen, Rep.ZambiaZimbabwe Timeline:
This timeline shows a graph from 1961 to 2016 of United States. No data until 1960. Number of actual observations by date: 56.
Source name:
World Development Indicators
Source organization:
World Bank national accounts data, and OECD National Accounts data files.
Categories, topics:
Economy & Growth
Last updated:
apr 23, 2017
Indicators value changes by year
Minimum:
58.368
jan 1, 1970
Maximum:
68.884
jan 1, 2012
At the date of observation
Value
Absolute change
Change from previous value
jan 1, 1961
61.053
+61.053
0.0%
jan 1, 1962
60.696
-0.357
-0.58%
jan 1, 1963
60.007
-0.689
-1.14%
jan 1, 1964
59.865
-0.141
-0.24%
jan 1, 1965
59.974
+0.108
0.18%
jan 1, 1966
59.648
-0.326
-0.54%
jan 1, 1967
58.957
-0.691
-1.16%
jan 1, 1968
58.884
-0.073
-0.12%
jan 1, 1969
59.151
+0.268
0.45%
jan 1, 1970
58.368
-0.783
-1.32%
jan 1, 1971
60.201
+1.832
3.14%
jan 1, 1972
60.028
-0.172
-0.29%
jan 1, 1973
59.997
-0.031
-0.05%
jan 1, 1974
59.581
-0.416
-0.69%
jan 1, 1975
60.175
+0.593
1.0%
jan 1, 1976
61.149
+0.974
1.62%
jan 1, 1977
61.258
+0.109
0.18%
jan 1, 1978
61.203
-0.055
-0.09%
jan 1, 1979
60.519
-0.684
-1.12%
jan 1, 1980
60.388
-0.131
-0.22%
jan 1, 1981
61.297
+0.909
1.5%
jan 1, 1982
60.341
-0.956
-1.56%
jan 1, 1983
62.0
+1.66
2.75%
jan 1, 1984
62.849
+0.848
1.37%
jan 1, 1985
61.825
-1.024
-1.63%
jan 1, 1986
62.637
+0.812
1.31%
jan 1, 1987
63.144
+0.507
0.81%
jan 1, 1988
63.489
+0.345
0.55%
jan 1, 1989
63.718
+0.229
0.36%
jan 1, 1990
63.503
-0.215
-0.34%
jan 1, 1991
63.978
+0.475
0.75%
jan 1, 1992
64.142
+0.164
0.26%
jan 1, 1993
64.467
+0.325
0.51%
jan 1, 1994
64.998
+0.531
0.82%
jan 1, 1995
64.868
-0.13
-0.2%
jan 1, 1996
65.033
+0.165
0.25%
jan 1, 1997
65.036
+0.003
0.0%
jan 1, 1998
64.596
-0.441
-0.68%
jan 1, 1999
64.946
+0.35
0.54%
jan 1, 2000
65.286
+0.34
0.52%
jan 1, 2001
66.043
+0.757
1.16%
jan 1, 2002
66.873
+0.83
1.26%
jan 1, 2003
67.265
+0.392
0.59%
jan 1, 2004
67.464
+0.199
0.3%
jan 1, 2005
67.292
-0.172
-0.25%
jan 1, 2006
67.163
-0.129
-0.19%
jan 1, 2007
67.148
-0.015
-0.02%
jan 1, 2008
67.349
+0.2
0.3%
jan 1, 2009
68.034
+0.685
1.02%
jan 1, 2010
68.293
+0.259
0.38%
jan 1, 2011
68.176
-0.116
-0.17%
jan 1, 2012
68.884
+0.707
1.04%
jan 1, 2013
68.403
-0.481
-0.7%
jan 1, 2014
68.066
-0.337
-0.49%
jan 1, 2015
68.207
+0.142
0.21%
jan 1, 2016
68.104
-0.103
-0.15%
Ranking of countries by current statistics by years


Comments: