29
/
en
AIzaSyAYiBZKx7MnpbEhh9jyipgxe19OcubqV5w
April 1, 2024
124900
Egypt, Arab Rep.
EGY
true
2
1
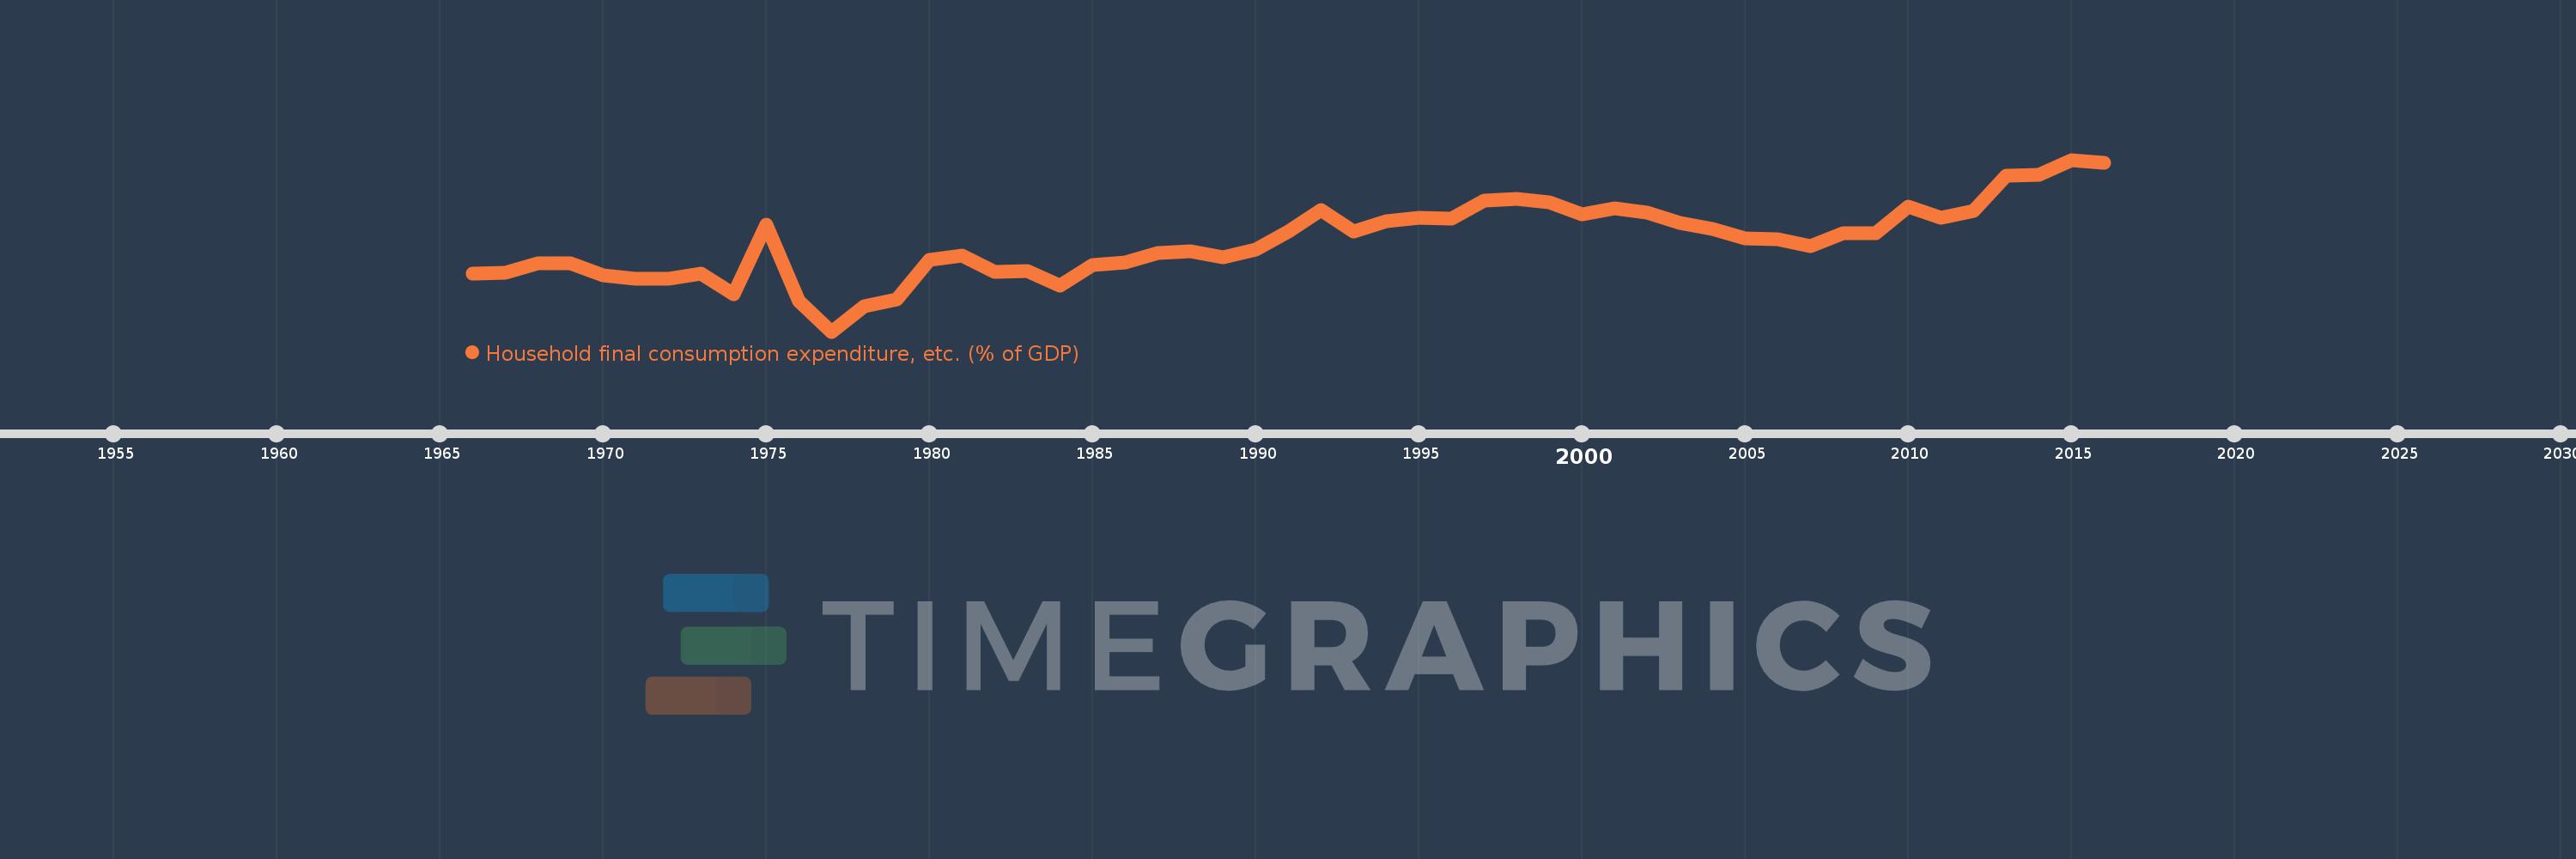
Household final consumption expenditure, etc. (% of GDP)
2016,2015,2014,2013,2012,2011,2010,2009,2008,2007,2006,2005,2004,2003,2002,2001,2000,1999,1998,1997,1996,1995,1994,1993,1992,1991,1990,1989,1988,1987,1986,1985,1984,1983,1982,1981,1980,1979,1978,1977,1976,1975,1974,1973,1972,1971,1970,1969,1968,1967,1966
This statistics in other country:
AfghanistanAlbaniaAlgeriaAngolaAntigua and BarbudaArab WorldArgentinaArmeniaArubaAustraliaAustriaAzerbaijanBahamas, TheBahrainBangladeshBarbadosBelarusBelgiumBelizeBeninBermudaBhutanBoliviaBosnia and HerzegovinaBotswanaBrazilBrunei DarussalamBulgariaBurkina FasoBurundiCabo VerdeCambodiaCameroonCanadaCaribbean small statesCentral African RepublicCentral Europe and the BalticsChadChileChinaColombiaComorosCongo, Dem. Rep.Congo, Rep.Costa RicaCote d'IvoireCroatiaCubaCyprusCzech RepublicDenmarkDjiboutiDominicaDominican RepublicEarly-demographic dividendEast Asia & PacificEast Asia & Pacific (excluding high income)East Asia & Pacific (IDA & IBRD countries)EcuadorEgypt, Arab Rep.El SalvadorEquatorial GuineaEritreaEstoniaEthiopiaEuro areaEurope & Central AsiaEurope & Central Asia (excluding high income)Europe & Central Asia (IDA & IBRD countries)European UnionFaroe IslandsFijiFinlandFragile and conflict affected situationsFranceGabonGambia, TheGeorgiaGermanyGhanaGreeceGrenadaGuatemalaGuineaGuinea-BissauGuyanaHaitiHeavily indebted poor countries (HIPC)High incomeHondurasHong Kong SAR, ChinaHungaryIBRD onlyIcelandIDA & IBRD totalIDA blendIDA onlyIDA totalIndiaIndonesiaIran, Islamic Rep.IraqIrelandIsraelItalyJamaicaJapanJordanKazakhstanKenyaKiribatiKorea, Rep.KosovoKuwaitKyrgyz RepublicLao PDRLate-demographic dividendLatin America & Caribbean Latin America & Caribbean (excluding high income)Latin America & the Caribbean (IDA & IBRD countries)LatviaLeast developed countries: UN classificationLebanonLesothoLiberiaLibyaLithuaniaLow & middle incomeLow incomeLower middle incomeLuxembourgMacao SAR, ChinaMacedonia, FYRMadagascarMalawiMalaysiaMaldivesMaliMaltaMauritaniaMauritiusMexicoMicronesia, Fed. Sts.Middle East & North AfricaMiddle East & North Africa (excluding high income)Middle East & North Africa (IDA & IBRD countries)Middle incomeMoldovaMongoliaMontenegroMoroccoMozambiqueNamibiaNepalNetherlandsNew CaledoniaNew ZealandNicaraguaNigerNigeriaNorth AmericaNorwayOECD membersOmanOther small statesPacific island small statesPakistanPanamaPapua New GuineaParaguayPeruPhilippinesPolandPortugalPost-demographic dividendPre-demographic dividendPuerto RicoQatarRomaniaRussian FederationRwandaSaudi ArabiaSenegalSerbiaSeychellesSierra LeoneSingaporeSlovak RepublicSloveniaSmall statesSolomon IslandsSomaliaSouth AfricaSouth AsiaSouth Asia (IDA & IBRD)South SudanSpainSri LankaSt. Kitts and NevisSt. LuciaSt. Vincent and the GrenadinesSub-Saharan Africa Sub-Saharan Africa (excluding high income)Sub-Saharan Africa (IDA & IBRD countries)SudanSurinameSwazilandSwedenSwitzerlandSyrian Arab RepublicTajikistanTanzaniaThailandTimor-LesteTogoTongaTrinidad and TobagoTunisiaTurkeyTurkmenistanUgandaUkraineUnited Arab EmiratesUnited KingdomUnited StatesUpper middle incomeUruguayUzbekistanVanuatuVenezuela, RBVietnamWest Bank and GazaWorldYemen, Rep.ZambiaZimbabwe Timeline:
This timeline shows a graph from 1966 to 2016 of Egypt, Arab Rep.. No data until 1965. Number of actual observations by date: 51.
Source name:
World Development Indicators
Source organization:
World Bank national accounts data, and OECD National Accounts data files.
Categories, topics:
Economy & Growth
Last updated:
apr 23, 2017
Indicators value changes by year
Maximum:
82.711
jan 1, 2015
At the date of observation
Value
Absolute change
Change from previous value
jan 1, 1966
66.655
+66.655
0.0%
jan 1, 1967
66.84
+0.185
0.28%
jan 1, 1968
68.136
+1.295
1.94%
jan 1, 1969
68.172
+0.036
0.05%
jan 1, 1970
66.4
-1.773
-2.6%
jan 1, 1971
65.91
-0.489
-0.74%
jan 1, 1972
65.996
+0.086
0.13%
jan 1, 1973
66.63
+0.634
0.96%
jan 1, 1974
63.81
-2.82
-4.23%
jan 1, 1975
73.542
+9.732
15.25%
jan 1, 1976
62.859
-10.683
-14.53%
jan 1, 1977
58.51
-4.349
-6.92%
jan 1, 1978
62.033
+3.522
6.02%
jan 1, 1979
63.073
+1.04
1.68%
jan 1, 1980
68.666
+5.593
8.87%
jan 1, 1981
69.168
+0.502
0.73%
jan 1, 1982
66.905
-2.263
-3.27%
jan 1, 1983
66.999
+0.093
0.14%
jan 1, 1984
65.006
-1.992
-2.97%
jan 1, 1985
67.945
+2.939
4.52%
jan 1, 1986
68.212
+0.267
0.39%
jan 1, 1987
69.627
+1.415
2.07%
jan 1, 1988
69.871
+0.245
0.35%
jan 1, 1989
68.988
-0.883
-1.26%
jan 1, 1990
70.052
+1.064
1.54%
jan 1, 1991
72.567
+2.515
3.59%
jan 1, 1992
75.619
+3.052
4.21%
jan 1, 1993
72.61
-3.009
-3.98%
jan 1, 1994
74.098
+1.488
2.05%
jan 1, 1995
74.571
+0.473
0.64%
jan 1, 1996
74.461
-0.111
-0.15%
jan 1, 1997
76.94
+2.479
3.33%
jan 1, 1998
77.172
+0.232
0.3%
jan 1, 1999
76.688
-0.484
-0.63%
jan 1, 2000
75.033
-1.655
-2.16%
jan 1, 2001
75.86
+0.828
1.1%
jan 1, 2002
75.272
-0.588
-0.78%
jan 1, 2003
73.766
-1.506
-2.0%
jan 1, 2004
73.03
-0.736
-1.0%
jan 1, 2005
71.667
-1.363
-1.87%
jan 1, 2006
71.551
-0.116
-0.16%
jan 1, 2007
70.601
-0.95
-1.33%
jan 1, 2008
72.395
+1.795
2.54%
jan 1, 2009
72.317
-0.078
-0.11%
jan 1, 2010
76.099
+3.781
5.23%
jan 1, 2011
74.573
-1.525
-2.0%
jan 1, 2012
75.567
+0.994
1.33%
jan 1, 2013
80.502
+4.935
6.53%
jan 1, 2014
80.6
+0.098
0.12%
jan 1, 2015
82.711
+2.111
2.62%
jan 1, 2016
82.24
-0.471
-0.57%
Ranking of countries by current statistics by years


Comments: