29
/
en
AIzaSyAYiBZKx7MnpbEhh9jyipgxe19OcubqV5w
April 1, 2024
248815
Sri Lanka
LKA
true
2
1
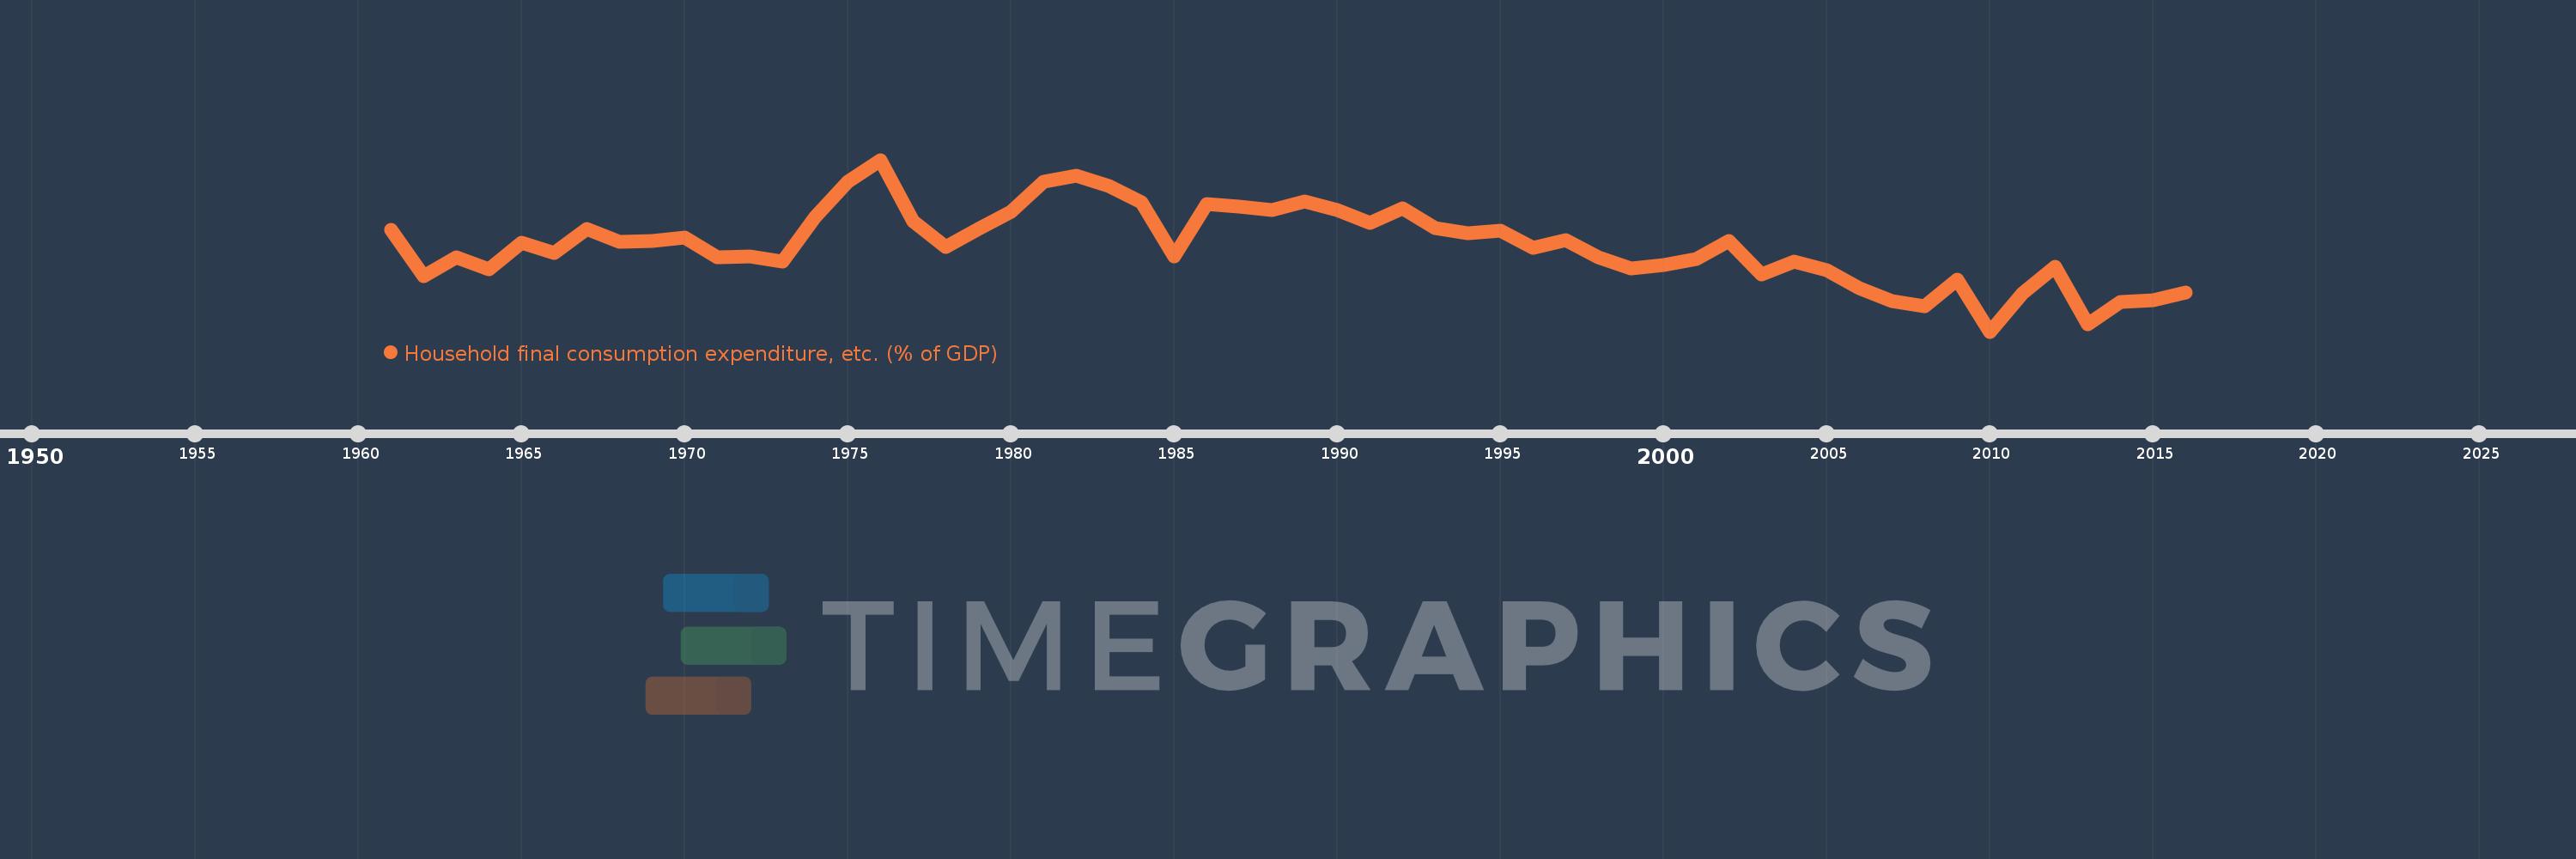
Household final consumption expenditure, etc. (% of GDP)
2016,2015,2014,2013,2012,2011,2010,2009,2008,2007,2006,2005,2004,2003,2002,2001,2000,1999,1998,1997,1996,1995,1994,1993,1992,1991,1990,1989,1988,1987,1986,1985,1984,1983,1982,1981,1980,1979,1978,1977,1976,1975,1974,1973,1972,1971,1970,1969,1968,1967,1966,1965,1964,1963,1962,1961
This statistics in other country:
AfghanistanAlbaniaAlgeriaAngolaAntigua and BarbudaArab WorldArgentinaArmeniaArubaAustraliaAustriaAzerbaijanBahamas, TheBahrainBangladeshBarbadosBelarusBelgiumBelizeBeninBermudaBhutanBoliviaBosnia and HerzegovinaBotswanaBrazilBrunei DarussalamBulgariaBurkina FasoBurundiCabo VerdeCambodiaCameroonCanadaCaribbean small statesCentral African RepublicCentral Europe and the BalticsChadChileChinaColombiaComorosCongo, Dem. Rep.Congo, Rep.Costa RicaCote d'IvoireCroatiaCubaCyprusCzech RepublicDenmarkDjiboutiDominicaDominican RepublicEarly-demographic dividendEast Asia & PacificEast Asia & Pacific (excluding high income)East Asia & Pacific (IDA & IBRD countries)EcuadorEgypt, Arab Rep.El SalvadorEquatorial GuineaEritreaEstoniaEthiopiaEuro areaEurope & Central AsiaEurope & Central Asia (excluding high income)Europe & Central Asia (IDA & IBRD countries)European UnionFaroe IslandsFijiFinlandFragile and conflict affected situationsFranceGabonGambia, TheGeorgiaGermanyGhanaGreeceGrenadaGuatemalaGuineaGuinea-BissauGuyanaHaitiHeavily indebted poor countries (HIPC)High incomeHondurasHong Kong SAR, ChinaHungaryIBRD onlyIcelandIDA & IBRD totalIDA blendIDA onlyIDA totalIndiaIndonesiaIran, Islamic Rep.IraqIrelandIsraelItalyJamaicaJapanJordanKazakhstanKenyaKiribatiKorea, Rep.KosovoKuwaitKyrgyz RepublicLao PDRLate-demographic dividendLatin America & Caribbean Latin America & Caribbean (excluding high income)Latin America & the Caribbean (IDA & IBRD countries)LatviaLeast developed countries: UN classificationLebanonLesothoLiberiaLibyaLithuaniaLow & middle incomeLow incomeLower middle incomeLuxembourgMacao SAR, ChinaMacedonia, FYRMadagascarMalawiMalaysiaMaldivesMaliMaltaMauritaniaMauritiusMexicoMicronesia, Fed. Sts.Middle East & North AfricaMiddle East & North Africa (excluding high income)Middle East & North Africa (IDA & IBRD countries)Middle incomeMoldovaMongoliaMontenegroMoroccoMozambiqueNamibiaNepalNetherlandsNew CaledoniaNew ZealandNicaraguaNigerNigeriaNorth AmericaNorwayOECD membersOmanOther small statesPacific island small statesPakistanPanamaPapua New GuineaParaguayPeruPhilippinesPolandPortugalPost-demographic dividendPre-demographic dividendPuerto RicoQatarRomaniaRussian FederationRwandaSaudi ArabiaSenegalSerbiaSeychellesSierra LeoneSingaporeSlovak RepublicSloveniaSmall statesSolomon IslandsSomaliaSouth AfricaSouth AsiaSouth Asia (IDA & IBRD)South SudanSpainSri LankaSt. Kitts and NevisSt. LuciaSt. Vincent and the GrenadinesSub-Saharan Africa Sub-Saharan Africa (excluding high income)Sub-Saharan Africa (IDA & IBRD countries)SudanSurinameSwazilandSwedenSwitzerlandSyrian Arab RepublicTajikistanTanzaniaThailandTimor-LesteTogoTongaTrinidad and TobagoTunisiaTurkeyTurkmenistanUgandaUkraineUnited Arab EmiratesUnited KingdomUnited StatesUpper middle incomeUruguayUzbekistanVanuatuVenezuela, RBVietnamWest Bank and GazaWorldYemen, Rep.ZambiaZimbabwe Timeline:
This timeline shows a graph from 1961 to 2016 of Sri Lanka. No data until 1960. Number of actual observations by date: 56.
Source name:
World Development Indicators
Source organization:
World Bank national accounts data, and OECD National Accounts data files.
Categories, topics:
Economy & Growth
Last updated:
apr 23, 2017
Indicators value changes by year
Minimum:
64.447
jan 1, 2010
At the date of observation
Value
Absolute change
Change from previous value
jan 1, 1961
75.175
+75.175
0.0%
jan 1, 1962
70.289
-4.886
-6.5%
jan 1, 1963
72.261
+1.972
2.81%
jan 1, 1964
71.047
-1.214
-1.68%
jan 1, 1965
73.804
+2.757
3.88%
jan 1, 1966
72.749
-1.055
-1.43%
jan 1, 1967
75.255
+2.506
3.45%
jan 1, 1968
73.885
-1.37
-1.82%
jan 1, 1969
73.977
+0.092
0.12%
jan 1, 1970
74.374
+0.396
0.54%
jan 1, 1971
72.321
-2.052
-2.76%
jan 1, 1972
72.377
+0.056
0.08%
jan 1, 1973
71.831
-0.547
-0.76%
jan 1, 1974
76.521
+4.691
6.53%
jan 1, 1975
80.215
+3.694
4.83%
jan 1, 1976
82.56
+2.345
2.92%
jan 1, 1977
76.122
-6.439
-7.8%
jan 1, 1978
73.332
-2.79
-3.66%
jan 1, 1979
75.249
+1.917
2.61%
jan 1, 1980
77.063
+1.814
2.41%
jan 1, 1981
80.267
+3.204
4.16%
jan 1, 1982
80.879
+0.612
0.76%
jan 1, 1983
79.834
-1.044
-1.29%
jan 1, 1984
78.079
-1.755
-2.2%
jan 1, 1985
72.35
-5.729
-7.34%
jan 1, 1986
77.908
+5.558
7.68%
jan 1, 1987
77.655
-0.253
-0.33%
jan 1, 1988
77.24
-0.415
-0.53%
jan 1, 1989
78.14
+0.9
1.17%
jan 1, 1990
77.287
-0.853
-1.09%
jan 1, 1991
75.917
-1.371
-1.77%
jan 1, 1992
77.405
+1.488
1.96%
jan 1, 1993
75.354
-2.052
-2.65%
jan 1, 1994
74.822
-0.531
-0.71%
jan 1, 1995
75.107
+0.285
0.38%
jan 1, 1996
73.237
-1.87
-2.49%
jan 1, 1997
74.13
+0.893
1.22%
jan 1, 1998
72.319
-1.811
-2.44%
jan 1, 1999
71.072
-1.247
-1.72%
jan 1, 2000
71.465
+0.393
0.55%
jan 1, 2001
72.055
+0.59
0.83%
jan 1, 2002
73.969
+1.914
2.66%
jan 1, 2003
70.501
-3.469
-4.69%
jan 1, 2004
71.848
+1.348
1.91%
jan 1, 2005
70.938
-0.911
-1.27%
jan 1, 2006
69.014
-1.923
-2.71%
jan 1, 2007
67.662
-1.352
-1.96%
jan 1, 2008
67.152
-0.51
-0.75%
jan 1, 2009
69.951
+2.798
4.17%
jan 1, 2010
64.447
-5.503
-7.87%
jan 1, 2011
68.451
+4.003
6.21%
jan 1, 2012
71.268
+2.817
4.11%
jan 1, 2013
65.179
-6.089
-8.54%
jan 1, 2014
67.594
+2.415
3.7%
jan 1, 2015
67.71
+0.116
0.17%
jan 1, 2016
68.552
+0.842
1.24%
Ranking of countries by current statistics by years


Comments: