29
/
en
AIzaSyAYiBZKx7MnpbEhh9jyipgxe19OcubqV5w
April 1, 2024
94965
Burkina Faso
BFA
true
2
1
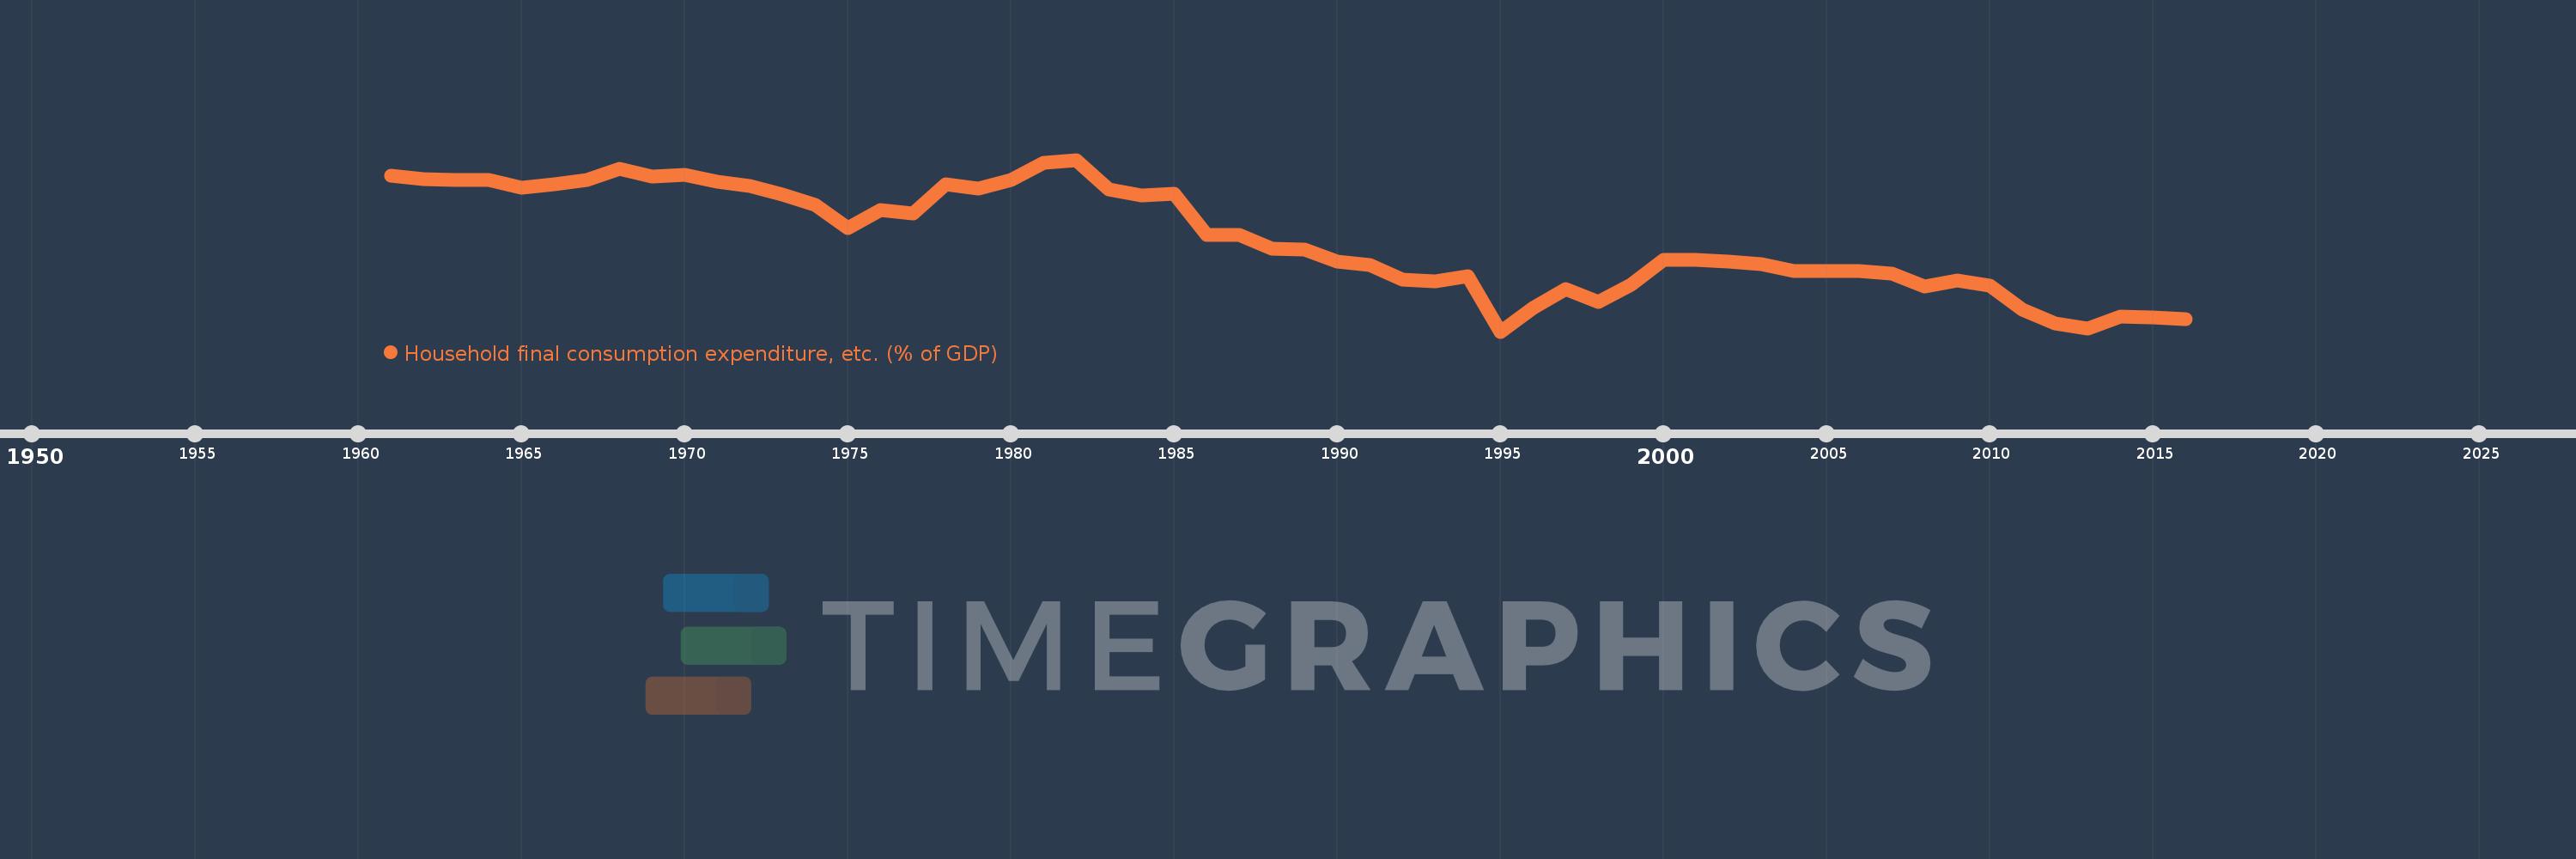
Household final consumption expenditure, etc. (% of GDP)
2016,2015,2014,2013,2012,2011,2010,2009,2008,2007,2006,2005,2004,2003,2002,2001,2000,1999,1998,1997,1996,1995,1994,1993,1992,1991,1990,1989,1988,1987,1986,1985,1984,1983,1982,1981,1980,1979,1978,1977,1976,1975,1974,1973,1972,1971,1970,1969,1968,1967,1966,1965,1964,1963,1962,1961
This statistics in other country:
AfghanistanAlbaniaAlgeriaAngolaAntigua and BarbudaArab WorldArgentinaArmeniaArubaAustraliaAustriaAzerbaijanBahamas, TheBahrainBangladeshBarbadosBelarusBelgiumBelizeBeninBermudaBhutanBoliviaBosnia and HerzegovinaBotswanaBrazilBrunei DarussalamBulgariaBurkina FasoBurundiCabo VerdeCambodiaCameroonCanadaCaribbean small statesCentral African RepublicCentral Europe and the BalticsChadChileChinaColombiaComorosCongo, Dem. Rep.Congo, Rep.Costa RicaCote d'IvoireCroatiaCubaCyprusCzech RepublicDenmarkDjiboutiDominicaDominican RepublicEarly-demographic dividendEast Asia & PacificEast Asia & Pacific (excluding high income)East Asia & Pacific (IDA & IBRD countries)EcuadorEgypt, Arab Rep.El SalvadorEquatorial GuineaEritreaEstoniaEthiopiaEuro areaEurope & Central AsiaEurope & Central Asia (excluding high income)Europe & Central Asia (IDA & IBRD countries)European UnionFaroe IslandsFijiFinlandFragile and conflict affected situationsFranceGabonGambia, TheGeorgiaGermanyGhanaGreeceGrenadaGuatemalaGuineaGuinea-BissauGuyanaHaitiHeavily indebted poor countries (HIPC)High incomeHondurasHong Kong SAR, ChinaHungaryIBRD onlyIcelandIDA & IBRD totalIDA blendIDA onlyIDA totalIndiaIndonesiaIran, Islamic Rep.IraqIrelandIsraelItalyJamaicaJapanJordanKazakhstanKenyaKiribatiKorea, Rep.KosovoKuwaitKyrgyz RepublicLao PDRLate-demographic dividendLatin America & Caribbean Latin America & Caribbean (excluding high income)Latin America & the Caribbean (IDA & IBRD countries)LatviaLeast developed countries: UN classificationLebanonLesothoLiberiaLibyaLithuaniaLow & middle incomeLow incomeLower middle incomeLuxembourgMacao SAR, ChinaMacedonia, FYRMadagascarMalawiMalaysiaMaldivesMaliMaltaMauritaniaMauritiusMexicoMicronesia, Fed. Sts.Middle East & North AfricaMiddle East & North Africa (excluding high income)Middle East & North Africa (IDA & IBRD countries)Middle incomeMoldovaMongoliaMontenegroMoroccoMozambiqueNamibiaNepalNetherlandsNew CaledoniaNew ZealandNicaraguaNigerNigeriaNorth AmericaNorwayOECD membersOmanOther small statesPacific island small statesPakistanPanamaPapua New GuineaParaguayPeruPhilippinesPolandPortugalPost-demographic dividendPre-demographic dividendPuerto RicoQatarRomaniaRussian FederationRwandaSaudi ArabiaSenegalSerbiaSeychellesSierra LeoneSingaporeSlovak RepublicSloveniaSmall statesSolomon IslandsSomaliaSouth AfricaSouth AsiaSouth Asia (IDA & IBRD)South SudanSpainSri LankaSt. Kitts and NevisSt. LuciaSt. Vincent and the GrenadinesSub-Saharan Africa Sub-Saharan Africa (excluding high income)Sub-Saharan Africa (IDA & IBRD countries)SudanSurinameSwazilandSwedenSwitzerlandSyrian Arab RepublicTajikistanTanzaniaThailandTimor-LesteTogoTongaTrinidad and TobagoTunisiaTurkeyTurkmenistanUgandaUkraineUnited Arab EmiratesUnited KingdomUnited StatesUpper middle incomeUruguayUzbekistanVanuatuVenezuela, RBVietnamWest Bank and GazaWorldYemen, Rep.ZambiaZimbabwe Timeline:
This timeline shows a graph from 1961 to 2016 of Burkina Faso. No data until 1960. Number of actual observations by date: 56.
Source name:
World Development Indicators
Source organization:
World Bank national accounts data, and OECD National Accounts data files.
Categories, topics:
Economy & Growth
Last updated:
apr 23, 2017
Indicators value changes by year
Minimum:
57.595
jan 1, 1995
Maximum:
98.774
jan 1, 1982
At the date of observation
Value
Absolute change
Change from previous value
jan 1, 1961
95.031
+95.031
0.0%
jan 1, 1962
94.053
-0.978
-1.03%
jan 1, 1963
93.918
-0.135
-0.14%
jan 1, 1964
93.902
-0.016
-0.02%
jan 1, 1965
92.098
-1.804
-1.92%
jan 1, 1966
92.961
+0.863
0.94%
jan 1, 1967
94.028
+1.067
1.15%
jan 1, 1968
96.657
+2.629
2.8%
jan 1, 1969
94.754
-1.903
-1.97%
jan 1, 1970
95.193
+0.439
0.46%
jan 1, 1971
93.471
-1.721
-1.81%
jan 1, 1972
92.41
-1.062
-1.14%
jan 1, 1973
90.346
-2.064
-2.23%
jan 1, 1974
87.894
-2.452
-2.71%
jan 1, 1975
82.363
-5.531
-6.29%
jan 1, 1976
86.806
+4.443
5.39%
jan 1, 1977
85.826
-0.98
-1.13%
jan 1, 1978
92.888
+7.062
8.23%
jan 1, 1979
91.915
-0.973
-1.05%
jan 1, 1980
93.842
+1.926
2.1%
jan 1, 1981
97.976
+4.134
4.41%
jan 1, 1982
98.774
+0.798
0.81%
jan 1, 1983
91.716
-7.058
-7.15%
jan 1, 1984
90.181
-1.535
-1.67%
jan 1, 1985
90.587
+0.406
0.45%
jan 1, 1986
80.849
-9.738
-10.75%
jan 1, 1987
80.852
+0.003
0.0%
jan 1, 1988
77.56
-3.292
-4.07%
jan 1, 1989
77.323
-0.237
-0.31%
jan 1, 1990
74.349
-2.975
-3.85%
jan 1, 1991
73.519
-0.83
-1.12%
jan 1, 1992
69.964
-3.554
-4.83%
jan 1, 1993
69.645
-0.319
-0.46%
jan 1, 1994
70.922
+1.277
1.83%
jan 1, 1995
57.595
-13.327
-18.79%
jan 1, 1996
63.342
+5.747
9.98%
jan 1, 1997
67.719
+4.376
6.91%
jan 1, 1998
64.666
-3.052
-4.51%
jan 1, 1999
68.852
+4.185
6.47%
jan 1, 2000
74.804
+5.952
8.64%
jan 1, 2001
74.721
-0.082
-0.11%
jan 1, 2002
74.3
-0.422
-0.56%
jan 1, 2003
73.799
-0.5
-0.67%
jan 1, 2004
72.134
-1.666
-2.26%
jan 1, 2005
72.034
-0.1
-0.14%
jan 1, 2006
72.183
+0.149
0.21%
jan 1, 2007
71.563
-0.619
-0.86%
jan 1, 2008
68.382
-3.181
-4.44%
jan 1, 2009
69.757
+1.374
2.01%
jan 1, 2010
68.518
-1.239
-1.78%
jan 1, 2011
62.842
-5.675
-8.28%
jan 1, 2012
59.614
-3.228
-5.14%
jan 1, 2013
58.346
-1.269
-2.13%
jan 1, 2014
61.18
+2.834
4.86%
jan 1, 2015
60.892
-0.288
-0.47%
jan 1, 2016
60.594
-0.297
-0.49%
Ranking of countries by current statistics by years


Comments: