29
/
en
AIzaSyAYiBZKx7MnpbEhh9jyipgxe19OcubqV5w
April 1, 2024
229853
Russian Federation
RUS
true
2
1
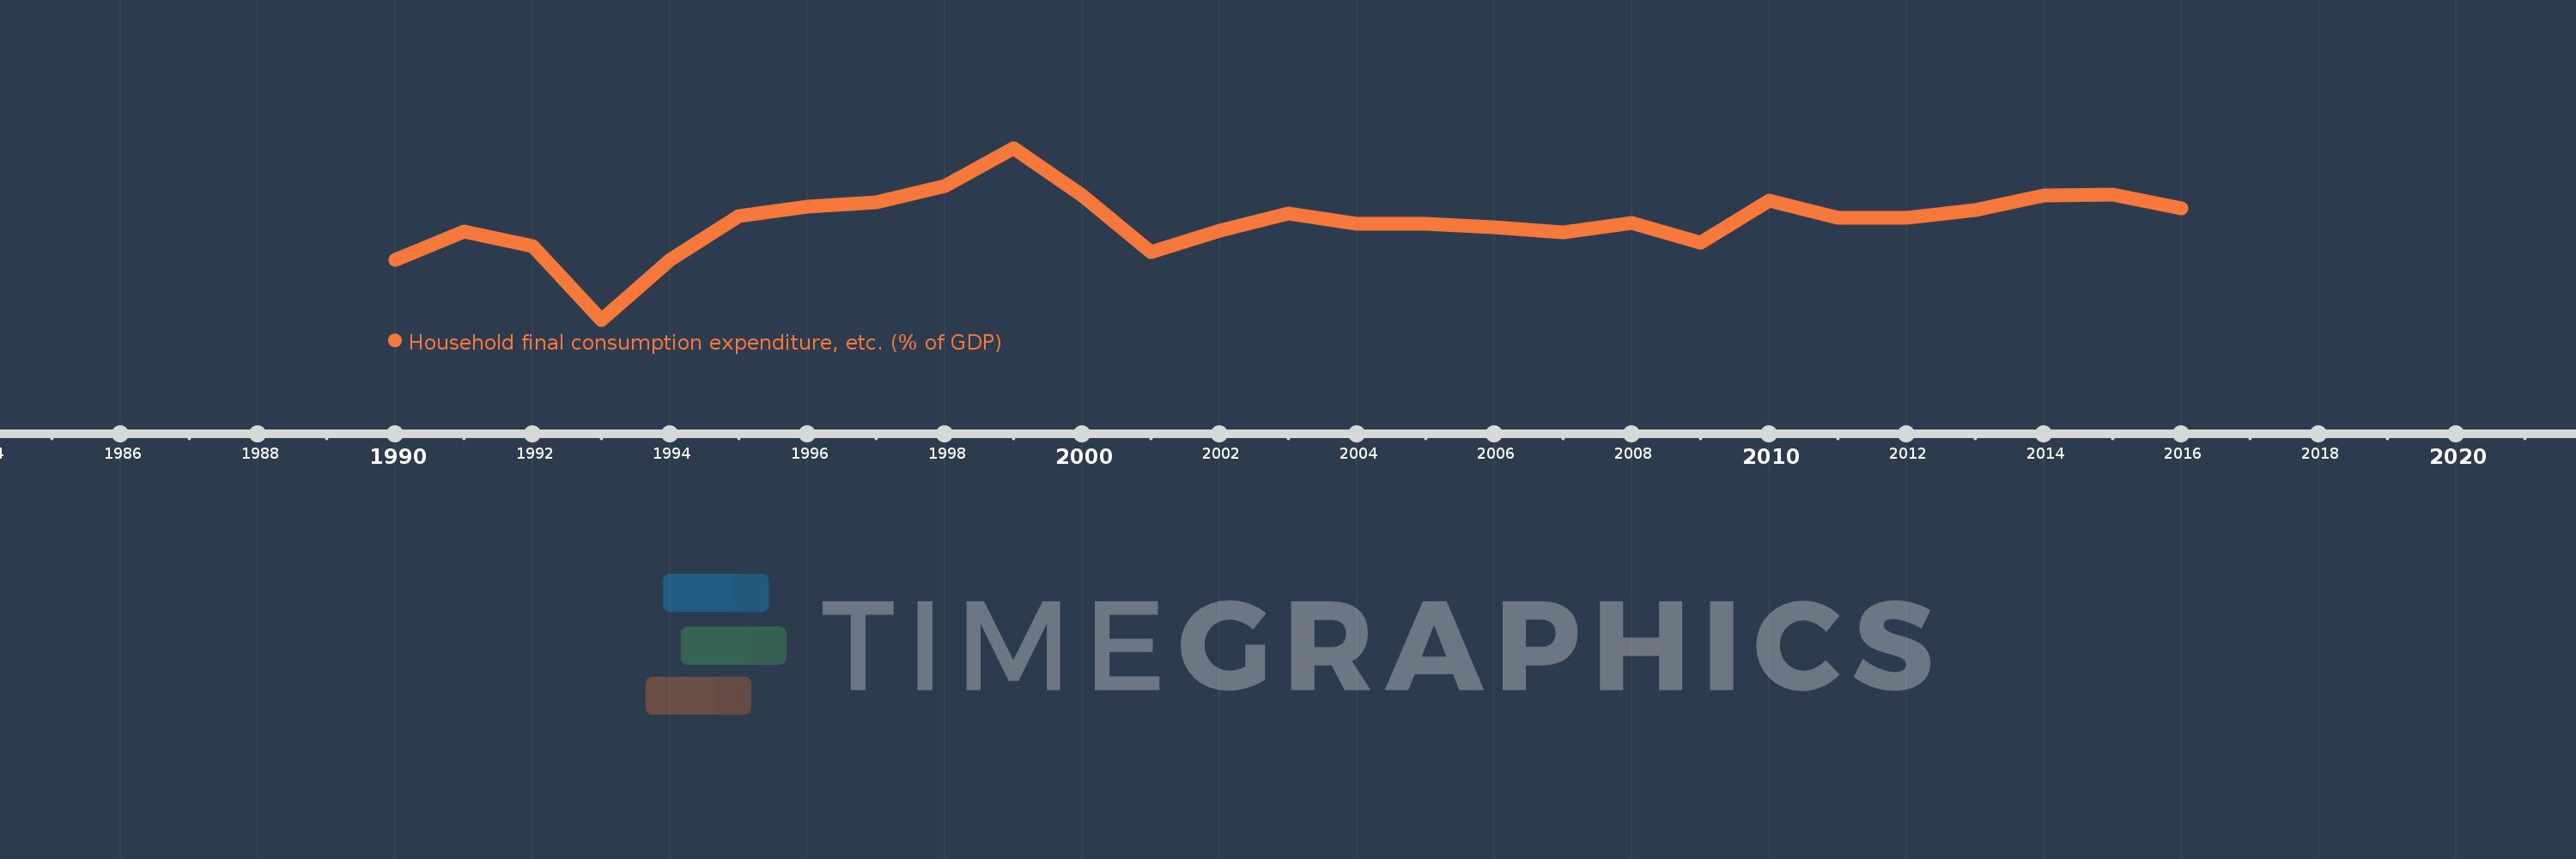
Household final consumption expenditure, etc. (% of GDP)
2016,2015,2014,2013,2012,2011,2010,2009,2008,2007,2006,2005,2004,2003,2002,2001,2000,1999,1998,1997,1996,1995,1994,1993,1992,1991,1990
This statistics in other country:
AfghanistanAlbaniaAlgeriaAngolaAntigua and BarbudaArab WorldArgentinaArmeniaArubaAustraliaAustriaAzerbaijanBahamas, TheBahrainBangladeshBarbadosBelarusBelgiumBelizeBeninBermudaBhutanBoliviaBosnia and HerzegovinaBotswanaBrazilBrunei DarussalamBulgariaBurkina FasoBurundiCabo VerdeCambodiaCameroonCanadaCaribbean small statesCentral African RepublicCentral Europe and the BalticsChadChileChinaColombiaComorosCongo, Dem. Rep.Congo, Rep.Costa RicaCote d'IvoireCroatiaCubaCyprusCzech RepublicDenmarkDjiboutiDominicaDominican RepublicEarly-demographic dividendEast Asia & PacificEast Asia & Pacific (excluding high income)East Asia & Pacific (IDA & IBRD countries)EcuadorEgypt, Arab Rep.El SalvadorEquatorial GuineaEritreaEstoniaEthiopiaEuro areaEurope & Central AsiaEurope & Central Asia (excluding high income)Europe & Central Asia (IDA & IBRD countries)European UnionFaroe IslandsFijiFinlandFragile and conflict affected situationsFranceGabonGambia, TheGeorgiaGermanyGhanaGreeceGrenadaGuatemalaGuineaGuinea-BissauGuyanaHaitiHeavily indebted poor countries (HIPC)High incomeHondurasHong Kong SAR, ChinaHungaryIBRD onlyIcelandIDA & IBRD totalIDA blendIDA onlyIDA totalIndiaIndonesiaIran, Islamic Rep.IraqIrelandIsraelItalyJamaicaJapanJordanKazakhstanKenyaKiribatiKorea, Rep.KosovoKuwaitKyrgyz RepublicLao PDRLate-demographic dividendLatin America & Caribbean Latin America & Caribbean (excluding high income)Latin America & the Caribbean (IDA & IBRD countries)LatviaLeast developed countries: UN classificationLebanonLesothoLiberiaLibyaLithuaniaLow & middle incomeLow incomeLower middle incomeLuxembourgMacao SAR, ChinaMacedonia, FYRMadagascarMalawiMalaysiaMaldivesMaliMaltaMauritaniaMauritiusMexicoMicronesia, Fed. Sts.Middle East & North AfricaMiddle East & North Africa (excluding high income)Middle East & North Africa (IDA & IBRD countries)Middle incomeMoldovaMongoliaMontenegroMoroccoMozambiqueNamibiaNepalNetherlandsNew CaledoniaNew ZealandNicaraguaNigerNigeriaNorth AmericaNorwayOECD membersOmanOther small statesPacific island small statesPakistanPanamaPapua New GuineaParaguayPeruPhilippinesPolandPortugalPost-demographic dividendPre-demographic dividendPuerto RicoQatarRomaniaRussian FederationRwandaSaudi ArabiaSenegalSerbiaSeychellesSierra LeoneSingaporeSlovak RepublicSloveniaSmall statesSolomon IslandsSomaliaSouth AfricaSouth AsiaSouth Asia (IDA & IBRD)South SudanSpainSri LankaSt. Kitts and NevisSt. LuciaSt. Vincent and the GrenadinesSub-Saharan Africa Sub-Saharan Africa (excluding high income)Sub-Saharan Africa (IDA & IBRD countries)SudanSurinameSwazilandSwedenSwitzerlandSyrian Arab RepublicTajikistanTanzaniaThailandTimor-LesteTogoTongaTrinidad and TobagoTunisiaTurkeyTurkmenistanUgandaUkraineUnited Arab EmiratesUnited KingdomUnited StatesUpper middle incomeUruguayUzbekistanVanuatuVenezuela, RBVietnamWest Bank and GazaWorldYemen, Rep.ZambiaZimbabwe Timeline:
This timeline shows a graph from 1990 to 2016 of Russian Federation. No data until 1989. Number of actual observations by date: 27.
Source name:
World Development Indicators
Source organization:
World Bank national accounts data, and OECD National Accounts data files.
Categories, topics:
Economy & Growth
Last updated:
apr 23, 2017
Indicators value changes by year
Minimum:
37.461
jan 1, 1993
Maximum:
59.633
jan 1, 1999
At the date of observation
Value
Absolute change
Change from previous value
jan 1, 1990
45.148
+45.148
0.0%
jan 1, 1991
48.867
+3.718
8.24%
jan 1, 1992
46.936
-1.931
-3.95%
jan 1, 1993
37.461
-9.475
-20.19%
jan 1, 1994
45.243
+7.782
20.77%
jan 1, 1995
50.8
+5.557
12.28%
jan 1, 1996
52.09
+1.29
2.54%
jan 1, 1997
52.615
+0.525
1.01%
jan 1, 1998
54.753
+2.139
4.06%
jan 1, 1999
59.633
+4.879
8.91%
jan 1, 2000
53.543
-6.089
-10.21%
jan 1, 2001
46.188
-7.355
-13.74%
jan 1, 2002
48.939
+2.751
5.96%
jan 1, 2003
51.205
+2.266
4.63%
jan 1, 2004
49.853
-1.352
-2.64%
jan 1, 2005
49.873
+0.02
0.04%
jan 1, 2006
49.358
-0.515
-1.03%
jan 1, 2007
48.713
-0.645
-1.31%
jan 1, 2008
49.916
+1.203
2.47%
jan 1, 2009
47.431
-2.484
-4.98%
jan 1, 2010
52.846
+5.414
11.42%
jan 1, 2011
50.584
-2.262
-4.28%
jan 1, 2012
50.569
-0.015
-0.03%
jan 1, 2013
51.596
+1.027
2.03%
jan 1, 2014
53.542
+1.946
3.77%
jan 1, 2015
53.566
+0.025
0.05%
jan 1, 2016
51.869
-1.698
-3.17%
Ranking of countries by current statistics by years


Comments: