29
/
en
AIzaSyAYiBZKx7MnpbEhh9jyipgxe19OcubqV5w
April 1, 2024
219666
Papua New Guinea
PNG
true
2
1
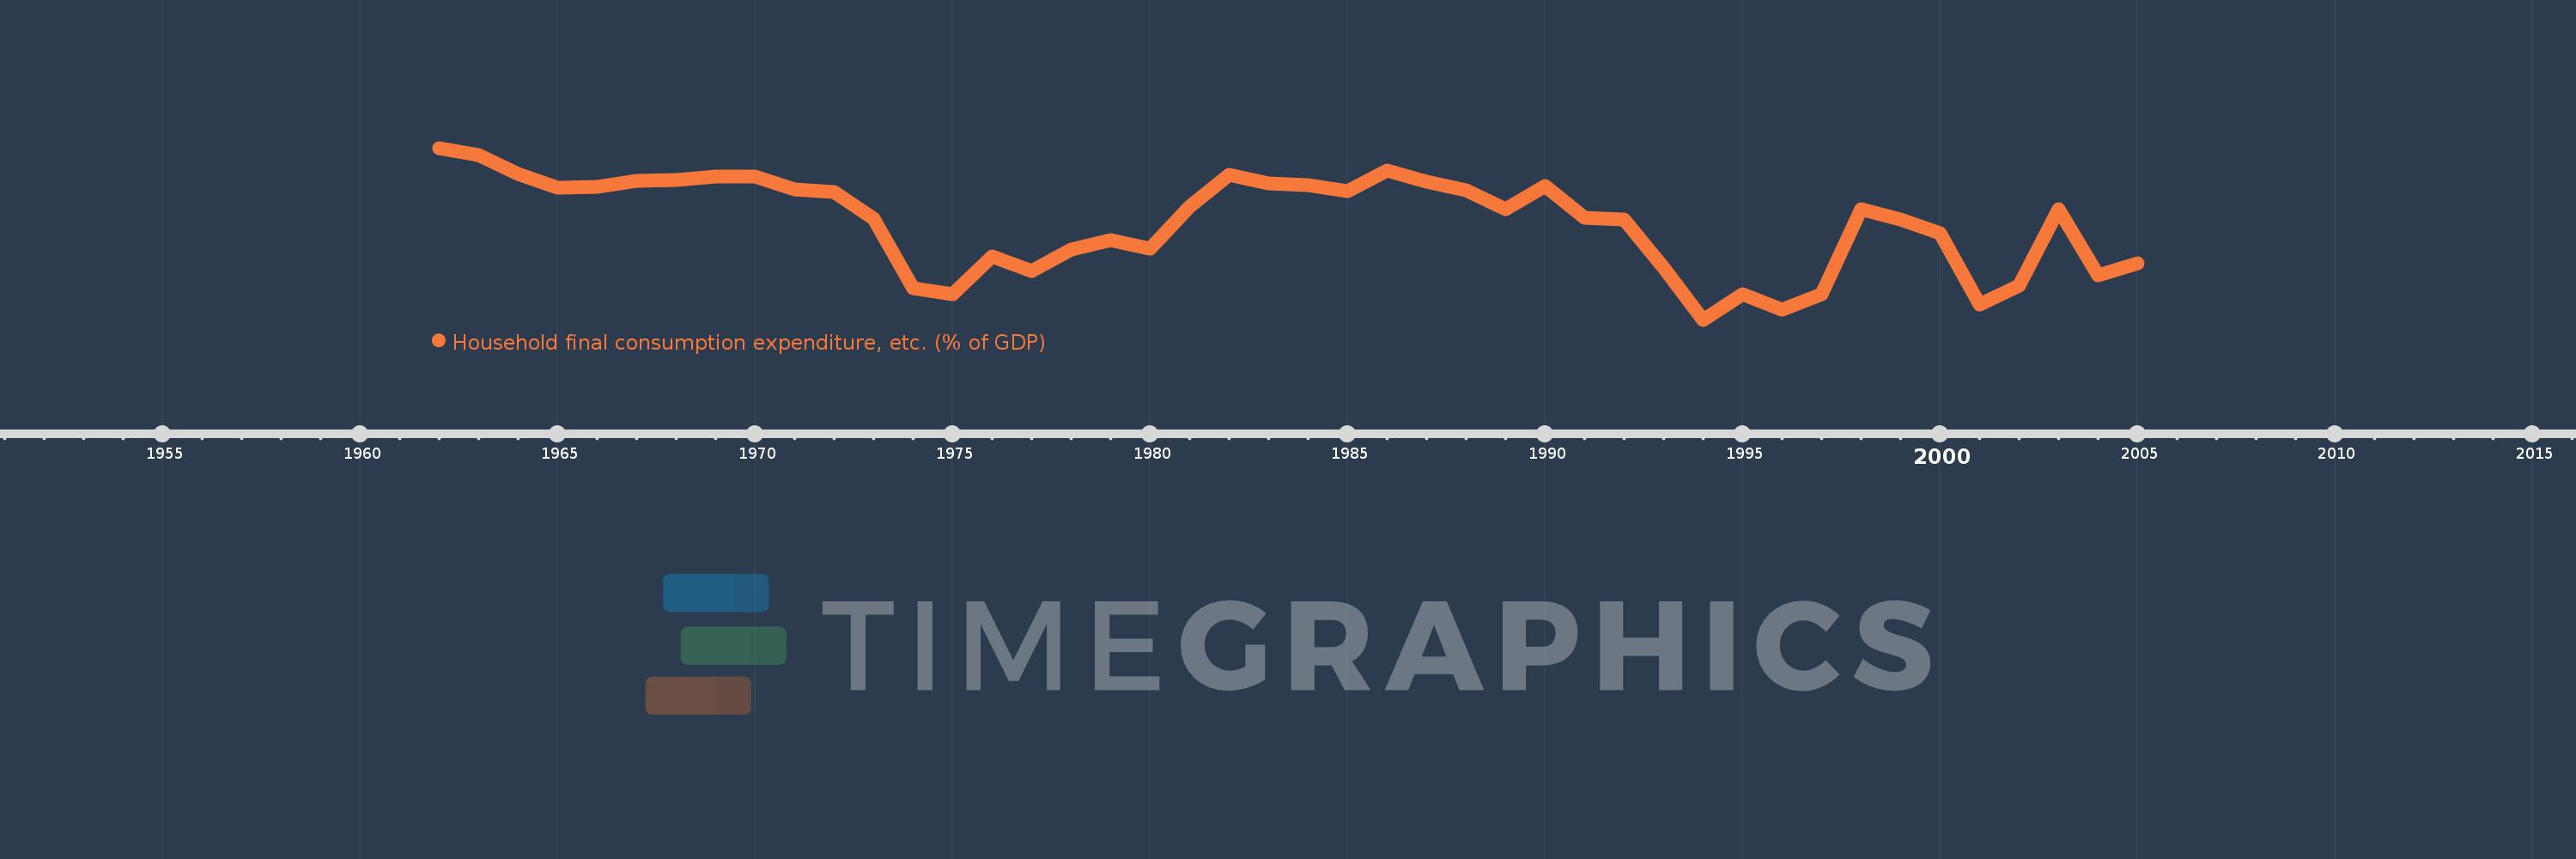
Household final consumption expenditure, etc. (% of GDP)
2005,2004,2003,2002,2001,2000,1999,1998,1997,1996,1995,1994,1993,1992,1991,1990,1989,1988,1987,1986,1985,1984,1983,1982,1981,1980,1979,1978,1977,1976,1975,1974,1973,1972,1971,1970,1969,1968,1967,1966,1965,1964,1963,1962
This statistics in other country:
AfghanistanAlbaniaAlgeriaAngolaAntigua and BarbudaArab WorldArgentinaArmeniaArubaAustraliaAustriaAzerbaijanBahamas, TheBahrainBangladeshBarbadosBelarusBelgiumBelizeBeninBermudaBhutanBoliviaBosnia and HerzegovinaBotswanaBrazilBrunei DarussalamBulgariaBurkina FasoBurundiCabo VerdeCambodiaCameroonCanadaCaribbean small statesCentral African RepublicCentral Europe and the BalticsChadChileChinaColombiaComorosCongo, Dem. Rep.Congo, Rep.Costa RicaCote d'IvoireCroatiaCubaCyprusCzech RepublicDenmarkDjiboutiDominicaDominican RepublicEarly-demographic dividendEast Asia & PacificEast Asia & Pacific (excluding high income)East Asia & Pacific (IDA & IBRD countries)EcuadorEgypt, Arab Rep.El SalvadorEquatorial GuineaEritreaEstoniaEthiopiaEuro areaEurope & Central AsiaEurope & Central Asia (excluding high income)Europe & Central Asia (IDA & IBRD countries)European UnionFaroe IslandsFijiFinlandFragile and conflict affected situationsFranceGabonGambia, TheGeorgiaGermanyGhanaGreeceGrenadaGuatemalaGuineaGuinea-BissauGuyanaHaitiHeavily indebted poor countries (HIPC)High incomeHondurasHong Kong SAR, ChinaHungaryIBRD onlyIcelandIDA & IBRD totalIDA blendIDA onlyIDA totalIndiaIndonesiaIran, Islamic Rep.IraqIrelandIsraelItalyJamaicaJapanJordanKazakhstanKenyaKiribatiKorea, Rep.KosovoKuwaitKyrgyz RepublicLao PDRLate-demographic dividendLatin America & Caribbean Latin America & Caribbean (excluding high income)Latin America & the Caribbean (IDA & IBRD countries)LatviaLeast developed countries: UN classificationLebanonLesothoLiberiaLibyaLithuaniaLow & middle incomeLow incomeLower middle incomeLuxembourgMacao SAR, ChinaMacedonia, FYRMadagascarMalawiMalaysiaMaldivesMaliMaltaMauritaniaMauritiusMexicoMicronesia, Fed. Sts.Middle East & North AfricaMiddle East & North Africa (excluding high income)Middle East & North Africa (IDA & IBRD countries)Middle incomeMoldovaMongoliaMontenegroMoroccoMozambiqueNamibiaNepalNetherlandsNew CaledoniaNew ZealandNicaraguaNigerNigeriaNorth AmericaNorwayOECD membersOmanOther small statesPacific island small statesPakistanPanamaPapua New GuineaParaguayPeruPhilippinesPolandPortugalPost-demographic dividendPre-demographic dividendPuerto RicoQatarRomaniaRussian FederationRwandaSaudi ArabiaSenegalSerbiaSeychellesSierra LeoneSingaporeSlovak RepublicSloveniaSmall statesSolomon IslandsSomaliaSouth AfricaSouth AsiaSouth Asia (IDA & IBRD)South SudanSpainSri LankaSt. Kitts and NevisSt. LuciaSt. Vincent and the GrenadinesSub-Saharan Africa Sub-Saharan Africa (excluding high income)Sub-Saharan Africa (IDA & IBRD countries)SudanSurinameSwazilandSwedenSwitzerlandSyrian Arab RepublicTajikistanTanzaniaThailandTimor-LesteTogoTongaTrinidad and TobagoTunisiaTurkeyTurkmenistanUgandaUkraineUnited Arab EmiratesUnited KingdomUnited StatesUpper middle incomeUruguayUzbekistanVanuatuVenezuela, RBVietnamWest Bank and GazaWorldYemen, Rep.ZambiaZimbabwe Timeline:
This timeline shows a graph from 1962 to 2005 of Papua New Guinea. No data until 1961. Number of actual observations by date: 44.
Source name:
World Development Indicators
Source organization:
World Bank national accounts data, and OECD National Accounts data files.
Categories, topics:
Economy & Growth
Last updated:
apr 23, 2017
Indicators value changes by year
Minimum:
42.027
jan 1, 1994
Maximum:
70.723
jan 1, 1962
At the date of observation
Value
Absolute change
Change from previous value
jan 1, 1962
70.723
+70.723
0.0%
jan 1, 1963
69.554
-1.169
-1.65%
jan 1, 1964
66.356
-3.199
-4.6%
jan 1, 1965
64.123
-2.232
-3.36%
jan 1, 1966
64.172
+0.049
0.08%
jan 1, 1967
65.168
+0.996
1.55%
jan 1, 1968
65.441
+0.274
0.42%
jan 1, 1969
65.951
+0.51
0.78%
jan 1, 1970
65.989
+0.038
0.06%
jan 1, 1971
63.775
-2.214
-3.36%
jan 1, 1972
63.321
-0.454
-0.71%
jan 1, 1973
58.862
-4.459
-7.04%
jan 1, 1974
47.229
-11.633
-19.76%
jan 1, 1975
46.278
-0.951
-2.01%
jan 1, 1976
52.591
+6.313
13.64%
jan 1, 1977
50.1
-2.491
-4.74%
jan 1, 1978
53.685
+3.585
7.16%
jan 1, 1979
55.276
+1.59
2.96%
jan 1, 1980
53.883
-1.392
-2.52%
jan 1, 1981
60.857
+6.974
12.94%
jan 1, 1982
66.227
+5.369
8.82%
jan 1, 1983
64.744
-1.483
-2.24%
jan 1, 1984
64.523
-0.221
-0.34%
jan 1, 1985
63.456
-1.066
-1.65%
jan 1, 1986
67.015
+3.558
5.61%
jan 1, 1987
65.059
-1.956
-2.92%
jan 1, 1988
63.588
-1.47
-2.26%
jan 1, 1989
60.553
-3.035
-4.77%
jan 1, 1990
64.419
+3.865
6.38%
jan 1, 1991
59.047
-5.372
-8.34%
jan 1, 1992
58.836
-0.211
-0.36%
jan 1, 1993
50.762
-8.074
-13.72%
jan 1, 1994
42.027
-8.735
-17.21%
jan 1, 1995
46.259
+4.232
10.07%
jan 1, 1996
43.642
-2.617
-5.66%
jan 1, 1997
46.341
+2.699
6.18%
jan 1, 1998
60.564
+14.223
30.69%
jan 1, 1999
58.811
-1.753
-2.89%
jan 1, 2000
56.452
-2.359
-4.01%
jan 1, 2001
44.605
-11.847
-20.99%
jan 1, 2002
47.732
+3.127
7.01%
jan 1, 2003
60.558
+12.827
26.87%
jan 1, 2004
49.436
-11.123
-18.37%
jan 1, 2005
51.439
+2.003
4.05%
Ranking of countries by current statistics by years


Comments: