29
/
en
AIzaSyAYiBZKx7MnpbEhh9jyipgxe19OcubqV5w
April 1, 2024
96216
Burundi
BDI
true
2
1
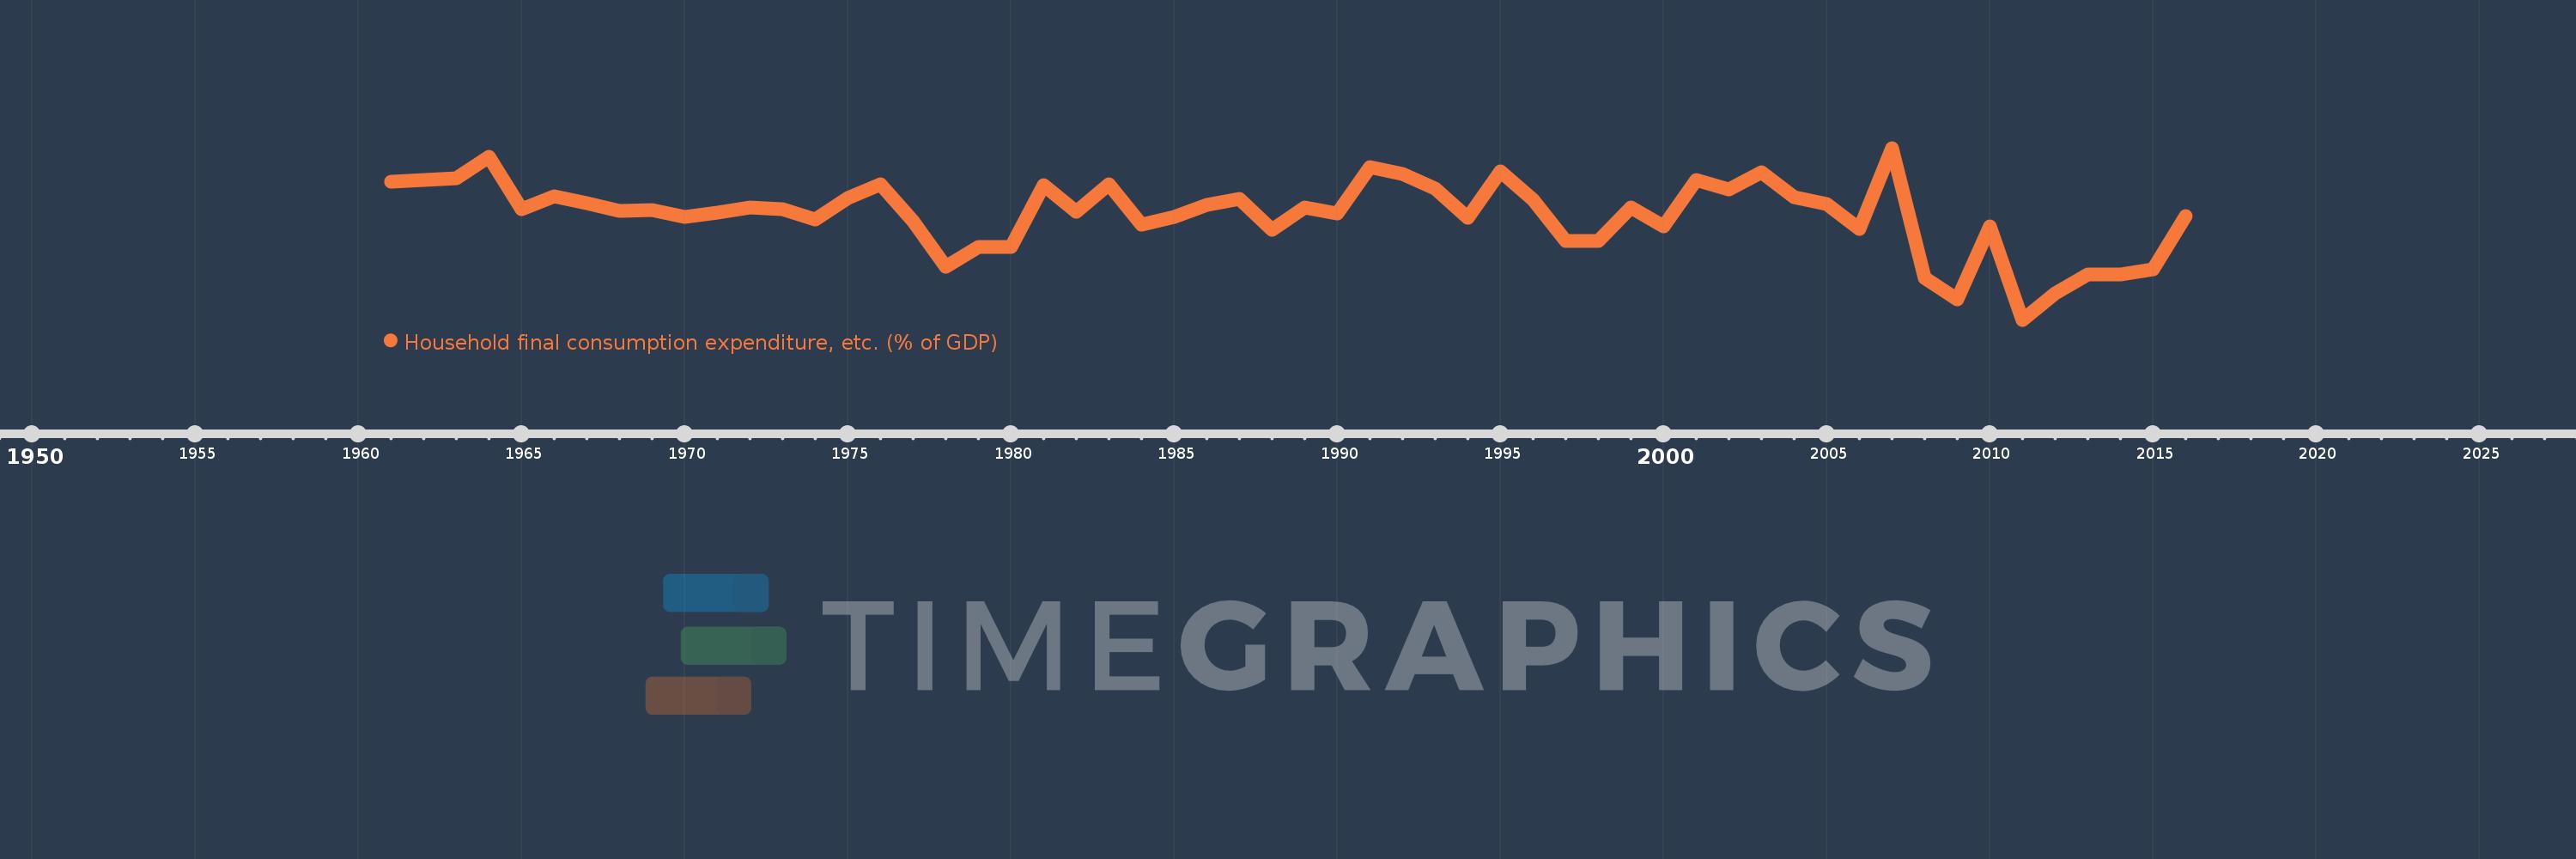
Household final consumption expenditure, etc. (% of GDP)
2016,2015,2014,2013,2012,2011,2010,2009,2008,2007,2006,2005,2004,2003,2002,2001,2000,1999,1998,1997,1996,1995,1994,1993,1992,1991,1990,1989,1988,1987,1986,1985,1984,1983,1982,1981,1980,1979,1978,1977,1976,1975,1974,1973,1972,1971,1970,1969,1968,1967,1966,1965,1964,1963,1962,1961
This statistics in other country:
AfghanistanAlbaniaAlgeriaAngolaAntigua and BarbudaArab WorldArgentinaArmeniaArubaAustraliaAustriaAzerbaijanBahamas, TheBahrainBangladeshBarbadosBelarusBelgiumBelizeBeninBermudaBhutanBoliviaBosnia and HerzegovinaBotswanaBrazilBrunei DarussalamBulgariaBurkina FasoBurundiCabo VerdeCambodiaCameroonCanadaCaribbean small statesCentral African RepublicCentral Europe and the BalticsChadChileChinaColombiaComorosCongo, Dem. Rep.Congo, Rep.Costa RicaCote d'IvoireCroatiaCubaCyprusCzech RepublicDenmarkDjiboutiDominicaDominican RepublicEarly-demographic dividendEast Asia & PacificEast Asia & Pacific (excluding high income)East Asia & Pacific (IDA & IBRD countries)EcuadorEgypt, Arab Rep.El SalvadorEquatorial GuineaEritreaEstoniaEthiopiaEuro areaEurope & Central AsiaEurope & Central Asia (excluding high income)Europe & Central Asia (IDA & IBRD countries)European UnionFaroe IslandsFijiFinlandFragile and conflict affected situationsFranceGabonGambia, TheGeorgiaGermanyGhanaGreeceGrenadaGuatemalaGuineaGuinea-BissauGuyanaHaitiHeavily indebted poor countries (HIPC)High incomeHondurasHong Kong SAR, ChinaHungaryIBRD onlyIcelandIDA & IBRD totalIDA blendIDA onlyIDA totalIndiaIndonesiaIran, Islamic Rep.IraqIrelandIsraelItalyJamaicaJapanJordanKazakhstanKenyaKiribatiKorea, Rep.KosovoKuwaitKyrgyz RepublicLao PDRLate-demographic dividendLatin America & Caribbean Latin America & Caribbean (excluding high income)Latin America & the Caribbean (IDA & IBRD countries)LatviaLeast developed countries: UN classificationLebanonLesothoLiberiaLibyaLithuaniaLow & middle incomeLow incomeLower middle incomeLuxembourgMacao SAR, ChinaMacedonia, FYRMadagascarMalawiMalaysiaMaldivesMaliMaltaMauritaniaMauritiusMexicoMicronesia, Fed. Sts.Middle East & North AfricaMiddle East & North Africa (excluding high income)Middle East & North Africa (IDA & IBRD countries)Middle incomeMoldovaMongoliaMontenegroMoroccoMozambiqueNamibiaNepalNetherlandsNew CaledoniaNew ZealandNicaraguaNigerNigeriaNorth AmericaNorwayOECD membersOmanOther small statesPacific island small statesPakistanPanamaPapua New GuineaParaguayPeruPhilippinesPolandPortugalPost-demographic dividendPre-demographic dividendPuerto RicoQatarRomaniaRussian FederationRwandaSaudi ArabiaSenegalSerbiaSeychellesSierra LeoneSingaporeSlovak RepublicSloveniaSmall statesSolomon IslandsSomaliaSouth AfricaSouth AsiaSouth Asia (IDA & IBRD)South SudanSpainSri LankaSt. Kitts and NevisSt. LuciaSt. Vincent and the GrenadinesSub-Saharan Africa Sub-Saharan Africa (excluding high income)Sub-Saharan Africa (IDA & IBRD countries)SudanSurinameSwazilandSwedenSwitzerlandSyrian Arab RepublicTajikistanTanzaniaThailandTimor-LesteTogoTongaTrinidad and TobagoTunisiaTurkeyTurkmenistanUgandaUkraineUnited Arab EmiratesUnited KingdomUnited StatesUpper middle incomeUruguayUzbekistanVanuatuVenezuela, RBVietnamWest Bank and GazaWorldYemen, Rep.ZambiaZimbabwe Timeline:
This timeline shows a graph from 1961 to 2016 of Burundi. No data until 1960. Number of actual observations by date: 56.
Source name:
World Development Indicators
Source organization:
World Bank national accounts data, and OECD National Accounts data files.
Categories, topics:
Economy & Growth
Last updated:
apr 23, 2017
Indicators value changes by year
Maximum:
97.841
jan 1, 2007
At the date of observation
Value
Absolute change
Change from previous value
jan 1, 1961
91.964
+91.964
0.0%
jan 1, 1962
92.241
+0.277
0.3%
jan 1, 1963
92.623
+0.382
0.41%
jan 1, 1964
96.241
+3.618
3.91%
jan 1, 1965
87.248
-8.992
-9.34%
jan 1, 1966
89.475
+2.226
2.55%
jan 1, 1967
88.349
-1.125
-1.26%
jan 1, 1968
86.968
-1.381
-1.56%
jan 1, 1969
87.082
+0.114
0.13%
jan 1, 1970
85.861
-1.22
-1.4%
jan 1, 1971
86.63
+0.769
0.9%
jan 1, 1972
87.544
+0.914
1.05%
jan 1, 1973
87.235
-0.308
-0.35%
jan 1, 1974
85.422
-1.813
-2.08%
jan 1, 1975
89.145
+3.723
4.36%
jan 1, 1976
91.6
+2.455
2.75%
jan 1, 1977
85.131
-6.469
-7.06%
jan 1, 1978
77.348
-7.783
-9.14%
jan 1, 1979
80.687
+3.339
4.32%
jan 1, 1980
80.794
+0.107
0.13%
jan 1, 1981
91.379
+10.585
13.1%
jan 1, 1982
86.819
-4.561
-4.99%
jan 1, 1983
91.579
+4.76
5.48%
jan 1, 1984
84.56
-7.019
-7.66%
jan 1, 1985
85.858
+1.298
1.54%
jan 1, 1986
88.067
+2.209
2.57%
jan 1, 1987
89.109
+1.041
1.18%
jan 1, 1988
83.689
-5.419
-6.08%
jan 1, 1989
87.621
+3.932
4.7%
jan 1, 1990
86.551
-1.07
-1.22%
jan 1, 1991
94.549
+7.998
9.24%
jan 1, 1992
93.41
-1.139
-1.21%
jan 1, 1993
90.852
-2.558
-2.74%
jan 1, 1994
85.747
-5.104
-5.62%
jan 1, 1995
93.822
+8.074
9.42%
jan 1, 1996
88.938
-4.884
-5.21%
jan 1, 1997
81.731
-7.207
-8.1%
jan 1, 1998
81.734
+0.003
0.0%
jan 1, 1999
87.527
+5.794
7.09%
jan 1, 2000
84.343
-3.184
-3.64%
jan 1, 2001
92.278
+7.935
9.41%
jan 1, 2002
90.604
-1.674
-1.81%
jan 1, 2003
93.621
+3.016
3.33%
jan 1, 2004
89.283
-4.337
-4.63%
jan 1, 2005
88.096
-1.187
-1.33%
jan 1, 2006
83.877
-4.219
-4.79%
jan 1, 2007
97.841
+13.964
16.65%
jan 1, 2008
75.345
-22.497
-22.99%
jan 1, 2009
71.615
-3.729
-4.95%
jan 1, 2010
84.225
+12.61
17.61%
jan 1, 2011
68.17
-16.056
-19.06%
jan 1, 2012
72.729
+4.559
6.69%
jan 1, 2013
75.937
+3.208
4.41%
jan 1, 2014
76.014
+0.078
0.1%
jan 1, 2015
76.911
+0.897
1.18%
jan 1, 2016
86.118
+9.208
11.97%
Ranking of countries by current statistics by years


Comments: