29
/
en
AIzaSyAYiBZKx7MnpbEhh9jyipgxe19OcubqV5w
April 1, 2024
182177
Luxembourg
LUX
true
2
1
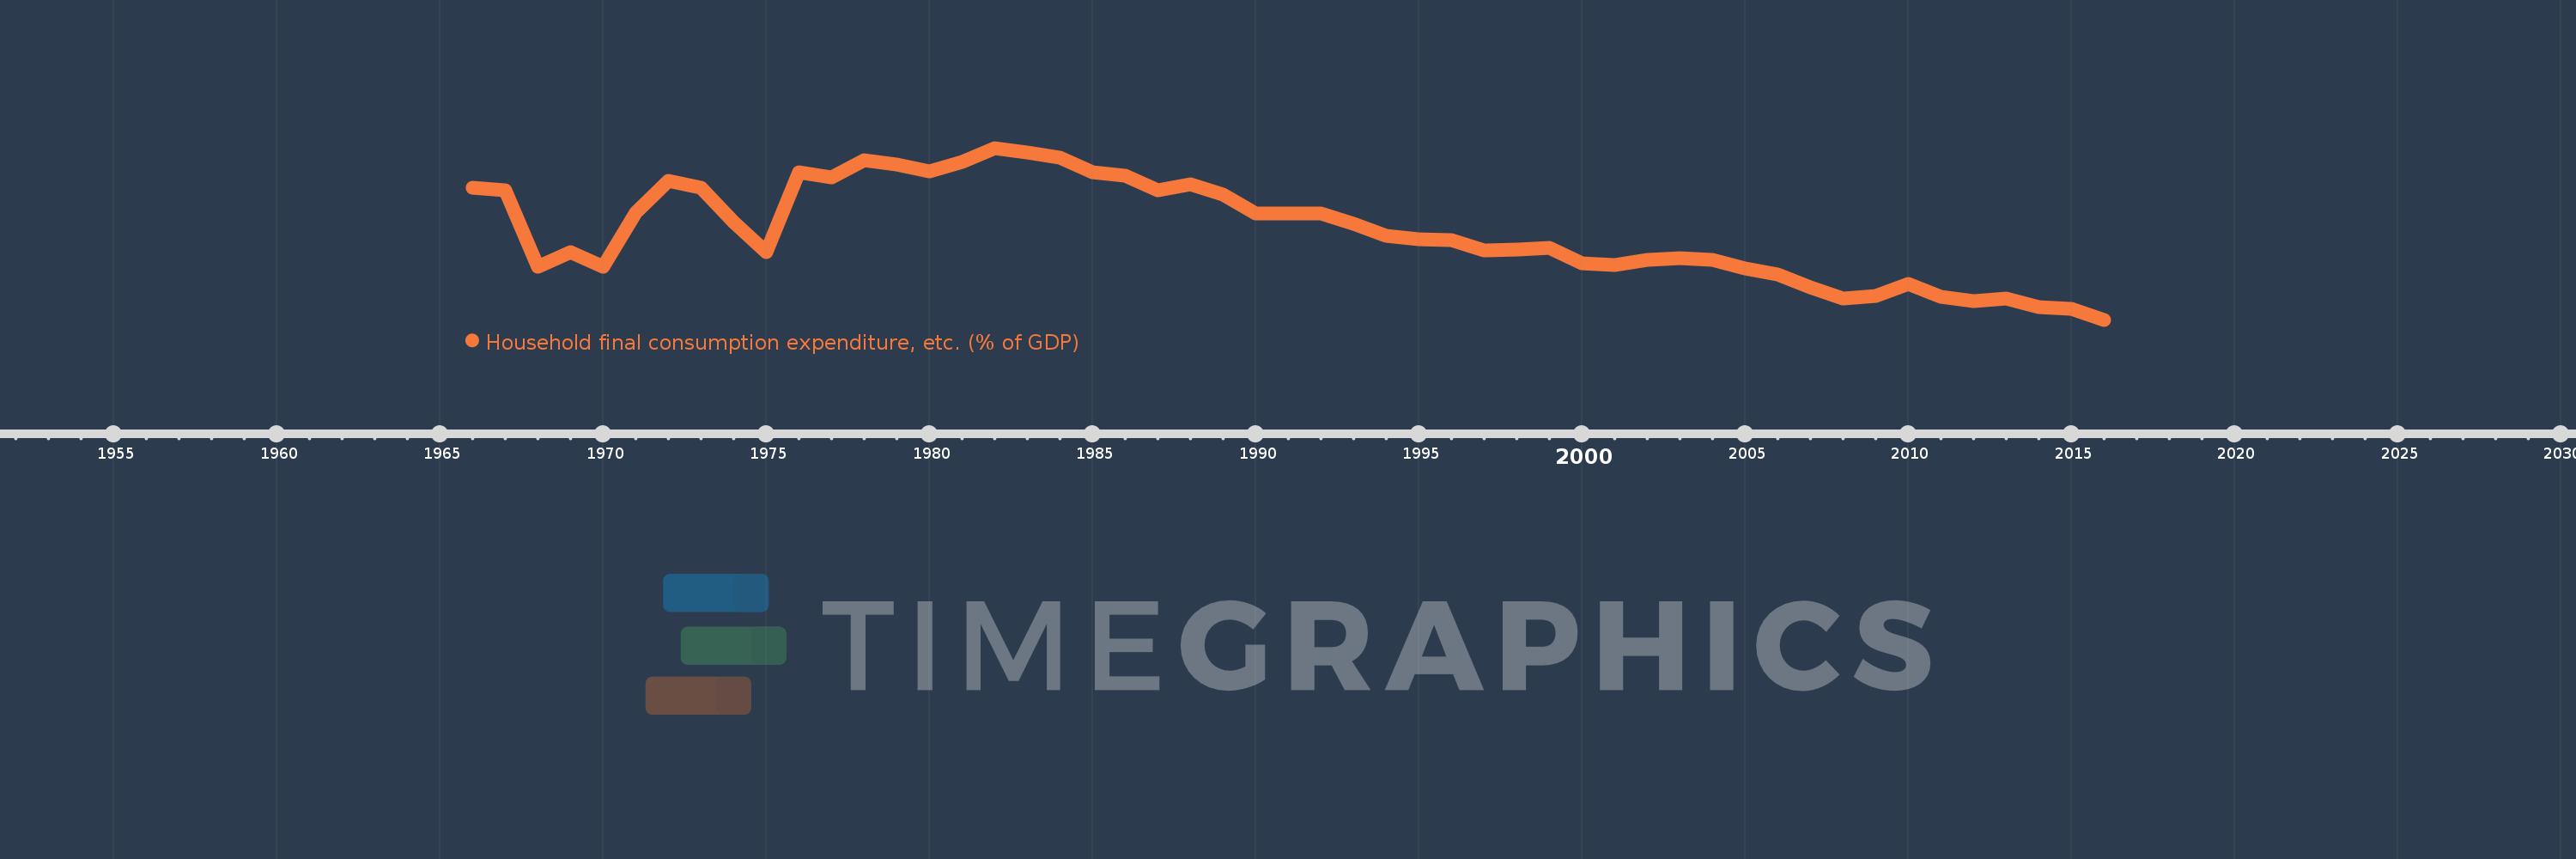
Household final consumption expenditure, etc. (% of GDP)
2016,2015,2014,2013,2012,2011,2010,2009,2008,2007,2006,2005,2004,2003,2002,2001,2000,1999,1998,1997,1996,1995,1994,1993,1992,1991,1990,1989,1988,1987,1986,1985,1984,1983,1982,1981,1980,1979,1978,1977,1976,1975,1974,1973,1972,1971,1970,1969,1968,1967,1966
This statistics in other country:
AfghanistanAlbaniaAlgeriaAngolaAntigua and BarbudaArab WorldArgentinaArmeniaArubaAustraliaAustriaAzerbaijanBahamas, TheBahrainBangladeshBarbadosBelarusBelgiumBelizeBeninBermudaBhutanBoliviaBosnia and HerzegovinaBotswanaBrazilBrunei DarussalamBulgariaBurkina FasoBurundiCabo VerdeCambodiaCameroonCanadaCaribbean small statesCentral African RepublicCentral Europe and the BalticsChadChileChinaColombiaComorosCongo, Dem. Rep.Congo, Rep.Costa RicaCote d'IvoireCroatiaCubaCyprusCzech RepublicDenmarkDjiboutiDominicaDominican RepublicEarly-demographic dividendEast Asia & PacificEast Asia & Pacific (excluding high income)East Asia & Pacific (IDA & IBRD countries)EcuadorEgypt, Arab Rep.El SalvadorEquatorial GuineaEritreaEstoniaEthiopiaEuro areaEurope & Central AsiaEurope & Central Asia (excluding high income)Europe & Central Asia (IDA & IBRD countries)European UnionFaroe IslandsFijiFinlandFragile and conflict affected situationsFranceGabonGambia, TheGeorgiaGermanyGhanaGreeceGrenadaGuatemalaGuineaGuinea-BissauGuyanaHaitiHeavily indebted poor countries (HIPC)High incomeHondurasHong Kong SAR, ChinaHungaryIBRD onlyIcelandIDA & IBRD totalIDA blendIDA onlyIDA totalIndiaIndonesiaIran, Islamic Rep.IraqIrelandIsraelItalyJamaicaJapanJordanKazakhstanKenyaKiribatiKorea, Rep.KosovoKuwaitKyrgyz RepublicLao PDRLate-demographic dividendLatin America & Caribbean Latin America & Caribbean (excluding high income)Latin America & the Caribbean (IDA & IBRD countries)LatviaLeast developed countries: UN classificationLebanonLesothoLiberiaLibyaLithuaniaLow & middle incomeLow incomeLower middle incomeLuxembourgMacao SAR, ChinaMacedonia, FYRMadagascarMalawiMalaysiaMaldivesMaliMaltaMauritaniaMauritiusMexicoMicronesia, Fed. Sts.Middle East & North AfricaMiddle East & North Africa (excluding high income)Middle East & North Africa (IDA & IBRD countries)Middle incomeMoldovaMongoliaMontenegroMoroccoMozambiqueNamibiaNepalNetherlandsNew CaledoniaNew ZealandNicaraguaNigerNigeriaNorth AmericaNorwayOECD membersOmanOther small statesPacific island small statesPakistanPanamaPapua New GuineaParaguayPeruPhilippinesPolandPortugalPost-demographic dividendPre-demographic dividendPuerto RicoQatarRomaniaRussian FederationRwandaSaudi ArabiaSenegalSerbiaSeychellesSierra LeoneSingaporeSlovak RepublicSloveniaSmall statesSolomon IslandsSomaliaSouth AfricaSouth AsiaSouth Asia (IDA & IBRD)South SudanSpainSri LankaSt. Kitts and NevisSt. LuciaSt. Vincent and the GrenadinesSub-Saharan Africa Sub-Saharan Africa (excluding high income)Sub-Saharan Africa (IDA & IBRD countries)SudanSurinameSwazilandSwedenSwitzerlandSyrian Arab RepublicTajikistanTanzaniaThailandTimor-LesteTogoTongaTrinidad and TobagoTunisiaTurkeyTurkmenistanUgandaUkraineUnited Arab EmiratesUnited KingdomUnited StatesUpper middle incomeUruguayUzbekistanVanuatuVenezuela, RBVietnamWest Bank and GazaWorldYemen, Rep.ZambiaZimbabwe Timeline:
This timeline shows a graph from 1966 to 2016 of Luxembourg. No data until 1965. Number of actual observations by date: 51.
Source name:
World Development Indicators
Source organization:
World Bank national accounts data, and OECD National Accounts data files.
Categories, topics:
Economy & Growth
Last updated:
apr 23, 2017
Indicators value changes by year
Minimum:
29.404
jan 1, 2016
At the date of observation
Value
Absolute change
Change from previous value
jan 1, 1966
50.627
+50.627
0.0%
jan 1, 1967
50.157
-0.47
-0.93%
jan 1, 1968
37.975
-12.182
-24.29%
jan 1, 1969
40.196
+2.221
5.85%
jan 1, 1970
37.911
-2.285
-5.68%
jan 1, 1971
46.593
+8.681
22.9%
jan 1, 1972
51.638
+5.046
10.83%
jan 1, 1973
50.603
-1.035
-2.0%
jan 1, 1974
45.106
-5.498
-10.86%
jan 1, 1975
40.271
-4.835
-10.72%
jan 1, 1976
53.143
+12.872
31.96%
jan 1, 1977
52.295
-0.848
-1.6%
jan 1, 1978
54.999
+2.704
5.17%
jan 1, 1979
54.332
-0.667
-1.21%
jan 1, 1980
53.182
-1.149
-2.12%
jan 1, 1981
54.786
+1.604
3.02%
jan 1, 1982
56.98
+2.193
4.0%
jan 1, 1983
56.276
-0.704
-1.24%
jan 1, 1984
55.431
-0.845
-1.5%
jan 1, 1985
53.104
-2.328
-4.2%
jan 1, 1986
52.533
-0.571
-1.08%
jan 1, 1987
50.12
-2.413
-4.59%
jan 1, 1988
51.196
+1.076
2.15%
jan 1, 1989
49.469
-1.726
-3.37%
jan 1, 1990
46.438
-3.032
-6.13%
jan 1, 1991
46.466
+0.028
0.06%
jan 1, 1992
46.416
-0.05
-0.11%
jan 1, 1993
44.815
-1.601
-3.45%
jan 1, 1994
42.926
-1.889
-4.22%
jan 1, 1995
42.278
-0.648
-1.51%
jan 1, 1996
42.169
-0.108
-0.26%
jan 1, 1997
40.493
-1.677
-3.98%
jan 1, 1998
40.635
+0.142
0.35%
jan 1, 1999
40.992
+0.358
0.88%
jan 1, 2000
38.43
-2.562
-6.25%
jan 1, 2001
38.179
-0.251
-0.65%
jan 1, 2002
39.062
+0.882
2.31%
jan 1, 2003
39.306
+0.245
0.63%
jan 1, 2004
39.049
-0.257
-0.65%
jan 1, 2005
37.569
-1.48
-3.79%
jan 1, 2006
36.669
-0.9
-2.4%
jan 1, 2007
34.553
-2.116
-5.77%
jan 1, 2008
32.872
-1.68
-4.86%
jan 1, 2009
33.265
+0.392
1.19%
jan 1, 2010
35.091
+1.826
5.49%
jan 1, 2011
33.078
-2.013
-5.74%
jan 1, 2012
32.437
-0.642
-1.94%
jan 1, 2013
32.826
+0.389
1.2%
jan 1, 2014
31.415
-1.411
-4.3%
jan 1, 2015
31.216
-0.199
-0.63%
jan 1, 2016
29.404
-1.812
-5.8%
Ranking of countries by current statistics by years


Comments: