29
/
en
AIzaSyAYiBZKx7MnpbEhh9jyipgxe19OcubqV5w
April 1, 2024
33504
European Union
EUU
false
2
1
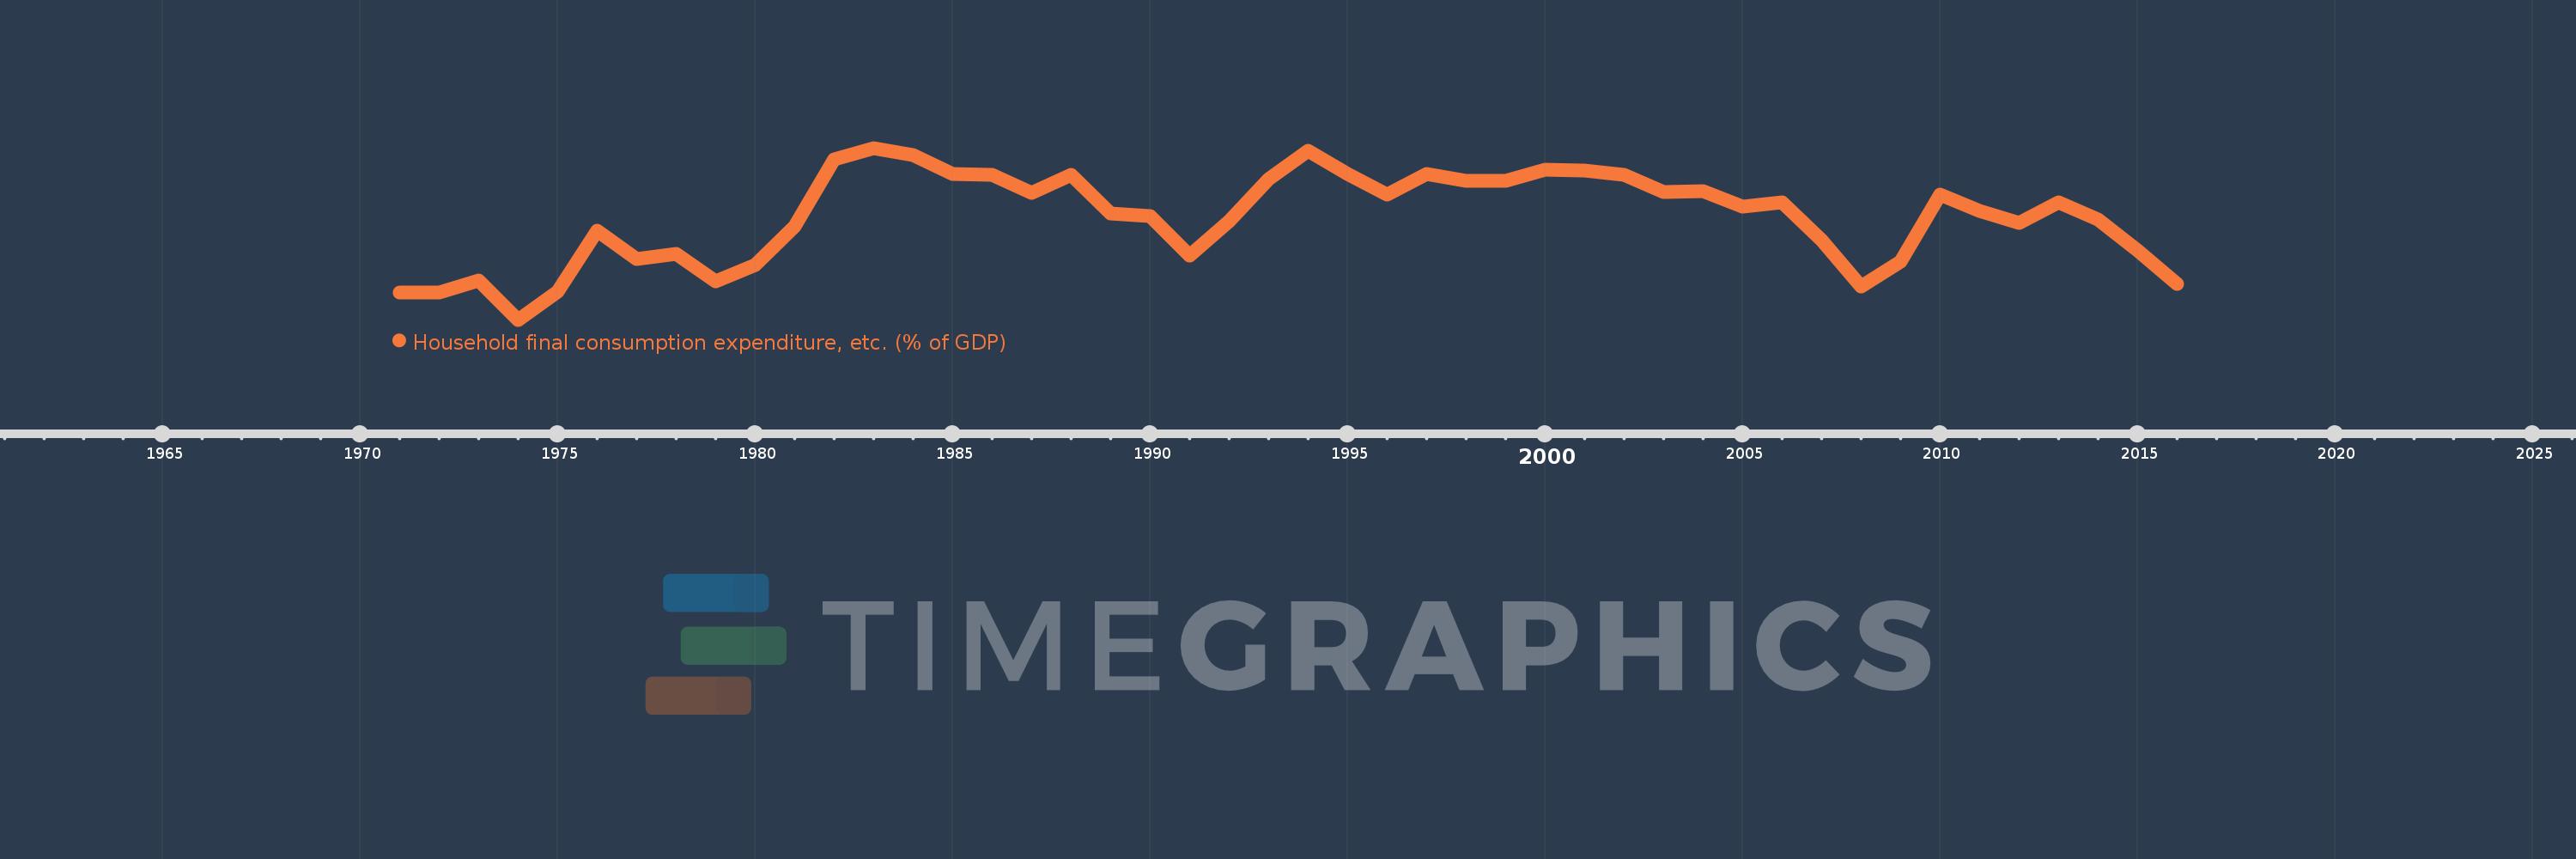
Household final consumption expenditure, etc. (% of GDP)
2016,2015,2014,2013,2012,2011,2010,2009,2008,2007,2006,2005,2004,2003,2002,2001,2000,1999,1998,1997,1996,1995,1994,1993,1992,1991,1990,1989,1988,1987,1986,1985,1984,1983,1982,1981,1980,1979,1978,1977,1976,1975,1974,1973,1972,1971
This statistics in other country:
AfghanistanAlbaniaAlgeriaAngolaAntigua and BarbudaArab WorldArgentinaArmeniaArubaAustraliaAustriaAzerbaijanBahamas, TheBahrainBangladeshBarbadosBelarusBelgiumBelizeBeninBermudaBhutanBoliviaBosnia and HerzegovinaBotswanaBrazilBrunei DarussalamBulgariaBurkina FasoBurundiCabo VerdeCambodiaCameroonCanadaCaribbean small statesCentral African RepublicCentral Europe and the BalticsChadChileChinaColombiaComorosCongo, Dem. Rep.Congo, Rep.Costa RicaCote d'IvoireCroatiaCubaCyprusCzech RepublicDenmarkDjiboutiDominicaDominican RepublicEarly-demographic dividendEast Asia & PacificEast Asia & Pacific (excluding high income)East Asia & Pacific (IDA & IBRD countries)EcuadorEgypt, Arab Rep.El SalvadorEquatorial GuineaEritreaEstoniaEthiopiaEuro areaEurope & Central AsiaEurope & Central Asia (excluding high income)Europe & Central Asia (IDA & IBRD countries)European UnionFaroe IslandsFijiFinlandFragile and conflict affected situationsFranceGabonGambia, TheGeorgiaGermanyGhanaGreeceGrenadaGuatemalaGuineaGuinea-BissauGuyanaHaitiHeavily indebted poor countries (HIPC)High incomeHondurasHong Kong SAR, ChinaHungaryIBRD onlyIcelandIDA & IBRD totalIDA blendIDA onlyIDA totalIndiaIndonesiaIran, Islamic Rep.IraqIrelandIsraelItalyJamaicaJapanJordanKazakhstanKenyaKiribatiKorea, Rep.KosovoKuwaitKyrgyz RepublicLao PDRLate-demographic dividendLatin America & Caribbean Latin America & Caribbean (excluding high income)Latin America & the Caribbean (IDA & IBRD countries)LatviaLeast developed countries: UN classificationLebanonLesothoLiberiaLibyaLithuaniaLow & middle incomeLow incomeLower middle incomeLuxembourgMacao SAR, ChinaMacedonia, FYRMadagascarMalawiMalaysiaMaldivesMaliMaltaMauritaniaMauritiusMexicoMicronesia, Fed. Sts.Middle East & North AfricaMiddle East & North Africa (excluding high income)Middle East & North Africa (IDA & IBRD countries)Middle incomeMoldovaMongoliaMontenegroMoroccoMozambiqueNamibiaNepalNetherlandsNew CaledoniaNew ZealandNicaraguaNigerNigeriaNorth AmericaNorwayOECD membersOmanOther small statesPacific island small statesPakistanPanamaPapua New GuineaParaguayPeruPhilippinesPolandPortugalPost-demographic dividendPre-demographic dividendPuerto RicoQatarRomaniaRussian FederationRwandaSaudi ArabiaSenegalSerbiaSeychellesSierra LeoneSingaporeSlovak RepublicSloveniaSmall statesSolomon IslandsSomaliaSouth AfricaSouth AsiaSouth Asia (IDA & IBRD)South SudanSpainSri LankaSt. Kitts and NevisSt. LuciaSt. Vincent and the GrenadinesSub-Saharan Africa Sub-Saharan Africa (excluding high income)Sub-Saharan Africa (IDA & IBRD countries)SudanSurinameSwazilandSwedenSwitzerlandSyrian Arab RepublicTajikistanTanzaniaThailandTimor-LesteTogoTongaTrinidad and TobagoTunisiaTurkeyTurkmenistanUgandaUkraineUnited Arab EmiratesUnited KingdomUnited StatesUpper middle incomeUruguayUzbekistanVanuatuVenezuela, RBVietnamWest Bank and GazaWorldYemen, Rep.ZambiaZimbabwe Timeline:
This timeline shows a graph from 1971 to 2016 of European Union. No data until 1970. Number of actual observations by date: 46.
Source name:
World Development Indicators
Source organization:
World Bank national accounts data, and OECD National Accounts data files.
Categories, topics:
Economy & Growth
Last updated:
apr 23, 2017
Indicators value changes by year
Minimum:
55.822
jan 1, 1974
Maximum:
58.132
jan 1, 1983
At the date of observation
Value
Absolute change
Change from previous value
jan 1, 1971
56.187
+56.187
0.0%
jan 1, 1972
56.183
-0.004
-0.01%
jan 1, 1973
56.347
+0.163
0.29%
jan 1, 1974
55.822
-0.525
-0.93%
jan 1, 1975
56.205
+0.382
0.69%
jan 1, 1976
57.023
+0.819
1.46%
jan 1, 1977
56.637
-0.386
-0.68%
jan 1, 1978
56.711
+0.074
0.13%
jan 1, 1979
56.34
-0.371
-0.65%
jan 1, 1980
56.559
+0.22
0.39%
jan 1, 1981
57.079
+0.519
0.92%
jan 1, 1982
57.984
+0.905
1.59%
jan 1, 1983
58.132
+0.148
0.25%
jan 1, 1984
58.041
-0.091
-0.16%
jan 1, 1985
57.785
-0.256
-0.44%
jan 1, 1986
57.768
-0.016
-0.03%
jan 1, 1987
57.523
-0.245
-0.42%
jan 1, 1988
57.772
+0.249
0.43%
jan 1, 1989
57.249
-0.524
-0.91%
jan 1, 1990
57.218
-0.03
-0.05%
jan 1, 1991
56.68
-0.538
-0.94%
jan 1, 1992
57.144
+0.463
0.82%
jan 1, 1993
57.708
+0.564
0.99%
jan 1, 1994
58.09
+0.381
0.66%
jan 1, 1995
57.786
-0.304
-0.52%
jan 1, 1996
57.501
-0.285
-0.49%
jan 1, 1997
57.785
+0.284
0.49%
jan 1, 1998
57.693
-0.092
-0.16%
jan 1, 1999
57.685
-0.008
-0.01%
jan 1, 2000
57.842
+0.157
0.27%
jan 1, 2001
57.834
-0.008
-0.01%
jan 1, 2002
57.771
-0.063
-0.11%
jan 1, 2003
57.541
-0.23
-0.4%
jan 1, 2004
57.551
+0.01
0.02%
jan 1, 2005
57.347
-0.204
-0.35%
jan 1, 2006
57.404
+0.056
0.1%
jan 1, 2007
56.89
-0.514
-0.9%
jan 1, 2008
56.266
-0.624
-1.1%
jan 1, 2009
56.599
+0.333
0.59%
jan 1, 2010
57.508
+0.91
1.61%
jan 1, 2011
57.288
-0.221
-0.38%
jan 1, 2012
57.123
-0.164
-0.29%
jan 1, 2013
57.406
+0.283
0.5%
jan 1, 2014
57.172
-0.234
-0.41%
jan 1, 2015
56.756
-0.416
-0.73%
jan 1, 2016
56.3
-0.457
-0.8%
Ranking of countries by current statistics by years


Comments: