29
/
en
AIzaSyAYiBZKx7MnpbEhh9jyipgxe19OcubqV5w
April 1, 2024
102521
Central African Republic
CAF
true
2
1
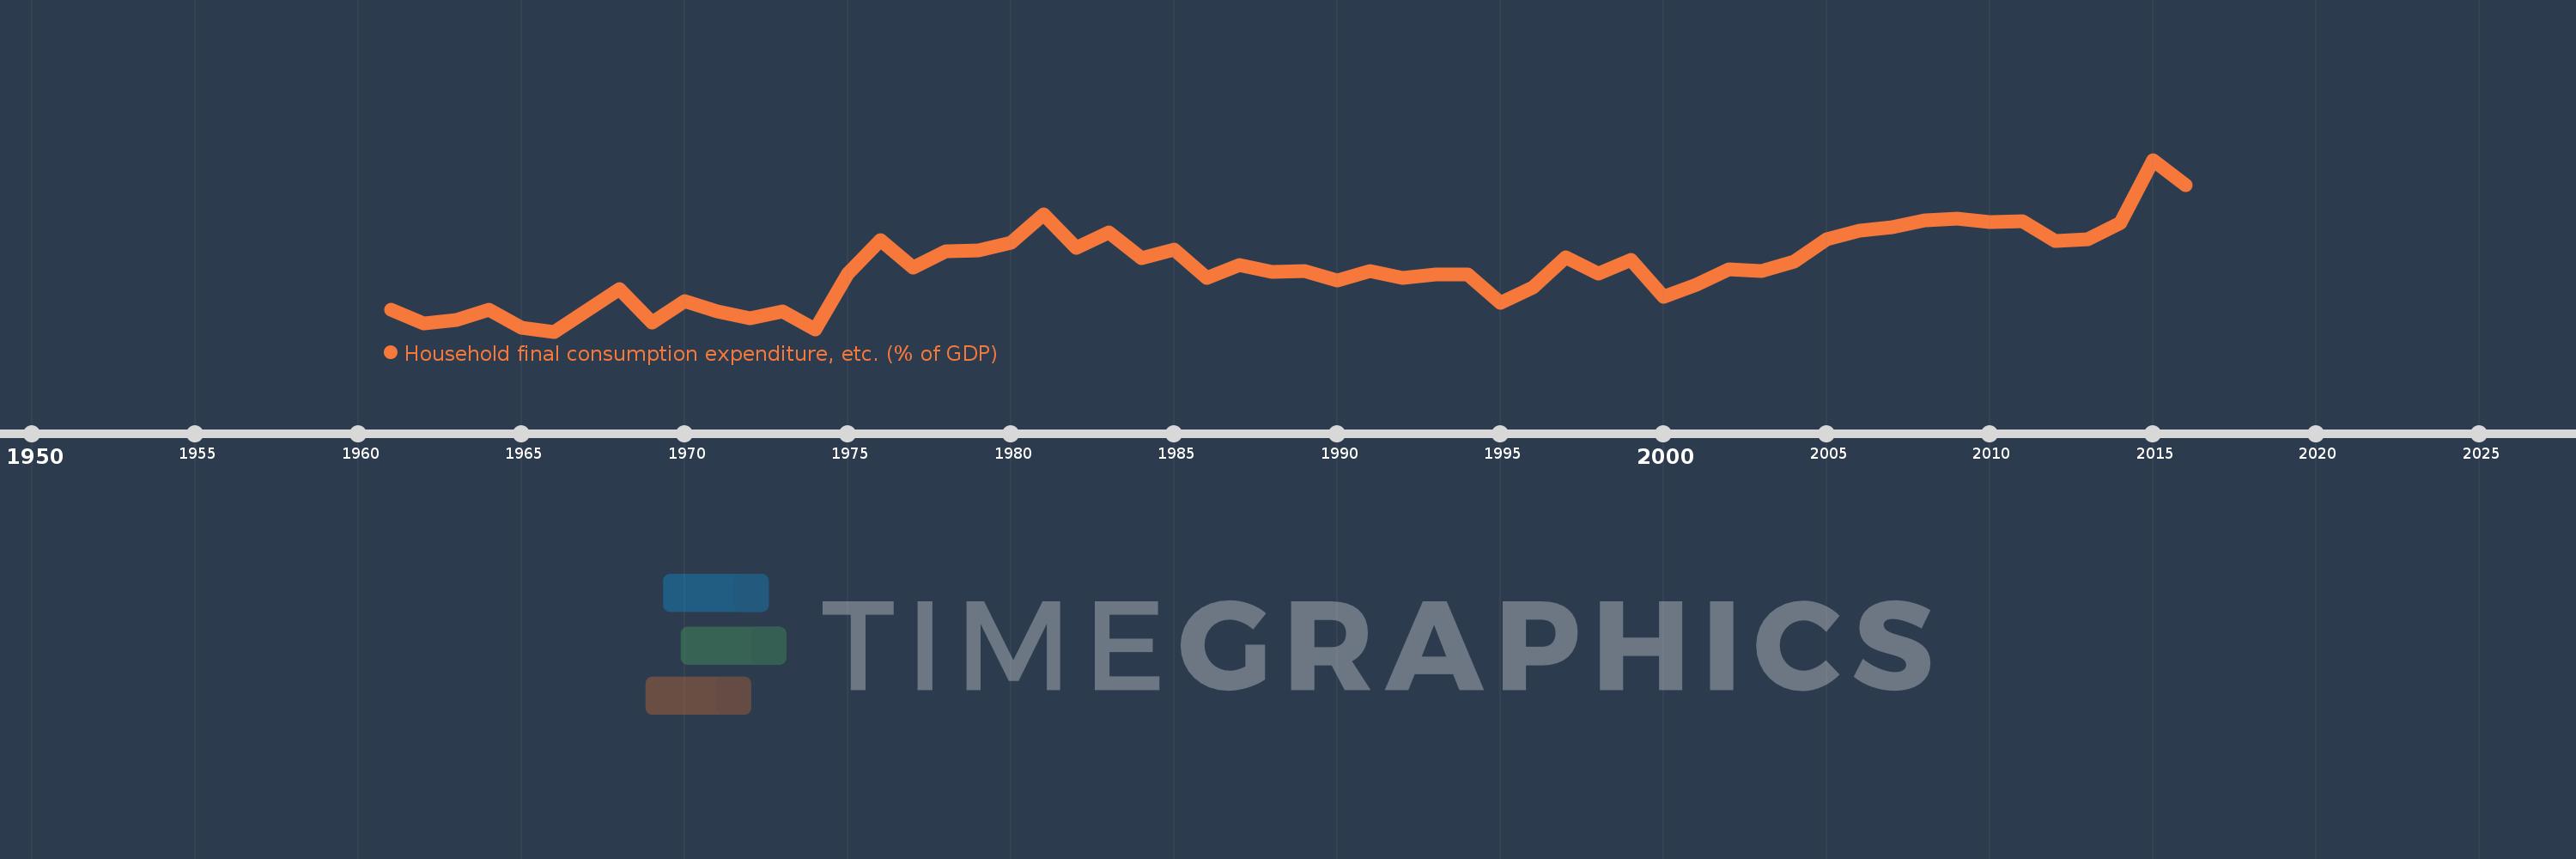
Household final consumption expenditure, etc. (% of GDP)
2016,2015,2014,2013,2012,2011,2010,2009,2008,2007,2006,2005,2004,2003,2002,2001,2000,1999,1998,1997,1996,1995,1994,1993,1992,1991,1990,1989,1988,1987,1986,1985,1984,1983,1982,1981,1980,1979,1978,1977,1976,1975,1974,1973,1972,1971,1970,1969,1968,1967,1966,1965,1964,1963,1962,1961
This statistics in other country:
AfghanistanAlbaniaAlgeriaAngolaAntigua and BarbudaArab WorldArgentinaArmeniaArubaAustraliaAustriaAzerbaijanBahamas, TheBahrainBangladeshBarbadosBelarusBelgiumBelizeBeninBermudaBhutanBoliviaBosnia and HerzegovinaBotswanaBrazilBrunei DarussalamBulgariaBurkina FasoBurundiCabo VerdeCambodiaCameroonCanadaCaribbean small statesCentral African RepublicCentral Europe and the BalticsChadChileChinaColombiaComorosCongo, Dem. Rep.Congo, Rep.Costa RicaCote d'IvoireCroatiaCubaCyprusCzech RepublicDenmarkDjiboutiDominicaDominican RepublicEarly-demographic dividendEast Asia & PacificEast Asia & Pacific (excluding high income)East Asia & Pacific (IDA & IBRD countries)EcuadorEgypt, Arab Rep.El SalvadorEquatorial GuineaEritreaEstoniaEthiopiaEuro areaEurope & Central AsiaEurope & Central Asia (excluding high income)Europe & Central Asia (IDA & IBRD countries)European UnionFaroe IslandsFijiFinlandFragile and conflict affected situationsFranceGabonGambia, TheGeorgiaGermanyGhanaGreeceGrenadaGuatemalaGuineaGuinea-BissauGuyanaHaitiHeavily indebted poor countries (HIPC)High incomeHondurasHong Kong SAR, ChinaHungaryIBRD onlyIcelandIDA & IBRD totalIDA blendIDA onlyIDA totalIndiaIndonesiaIran, Islamic Rep.IraqIrelandIsraelItalyJamaicaJapanJordanKazakhstanKenyaKiribatiKorea, Rep.KosovoKuwaitKyrgyz RepublicLao PDRLate-demographic dividendLatin America & Caribbean Latin America & Caribbean (excluding high income)Latin America & the Caribbean (IDA & IBRD countries)LatviaLeast developed countries: UN classificationLebanonLesothoLiberiaLibyaLithuaniaLow & middle incomeLow incomeLower middle incomeLuxembourgMacao SAR, ChinaMacedonia, FYRMadagascarMalawiMalaysiaMaldivesMaliMaltaMauritaniaMauritiusMexicoMicronesia, Fed. Sts.Middle East & North AfricaMiddle East & North Africa (excluding high income)Middle East & North Africa (IDA & IBRD countries)Middle incomeMoldovaMongoliaMontenegroMoroccoMozambiqueNamibiaNepalNetherlandsNew CaledoniaNew ZealandNicaraguaNigerNigeriaNorth AmericaNorwayOECD membersOmanOther small statesPacific island small statesPakistanPanamaPapua New GuineaParaguayPeruPhilippinesPolandPortugalPost-demographic dividendPre-demographic dividendPuerto RicoQatarRomaniaRussian FederationRwandaSaudi ArabiaSenegalSerbiaSeychellesSierra LeoneSingaporeSlovak RepublicSloveniaSmall statesSolomon IslandsSomaliaSouth AfricaSouth AsiaSouth Asia (IDA & IBRD)South SudanSpainSri LankaSt. Kitts and NevisSt. LuciaSt. Vincent and the GrenadinesSub-Saharan Africa Sub-Saharan Africa (excluding high income)Sub-Saharan Africa (IDA & IBRD countries)SudanSurinameSwazilandSwedenSwitzerlandSyrian Arab RepublicTajikistanTanzaniaThailandTimor-LesteTogoTongaTrinidad and TobagoTunisiaTurkeyTurkmenistanUgandaUkraineUnited Arab EmiratesUnited KingdomUnited StatesUpper middle incomeUruguayUzbekistanVanuatuVenezuela, RBVietnamWest Bank and GazaWorldYemen, Rep.ZambiaZimbabwe Timeline:
This timeline shows a graph from 1961 to 2016 of Central African Republic. No data until 1960. Number of actual observations by date: 56.
Source name:
World Development Indicators
Source organization:
World Bank national accounts data, and OECD National Accounts data files.
Categories, topics:
Economy & Growth
Last updated:
apr 23, 2017
Indicators value changes by year
Minimum:
66.938
jan 1, 1966
Maximum:
106.124
jan 1, 2015
At the date of observation
Value
Absolute change
Change from previous value
jan 1, 1961
72.0
+72.0
0.0%
jan 1, 1962
68.874
-3.126
-4.34%
jan 1, 1963
69.508
+0.634
0.92%
jan 1, 1964
71.924
+2.416
3.48%
jan 1, 1965
67.816
-4.108
-5.71%
jan 1, 1966
66.938
-0.878
-1.3%
jan 1, 1967
71.649
+4.712
7.04%
jan 1, 1968
76.675
+5.025
7.01%
jan 1, 1969
69.089
-7.586
-9.89%
jan 1, 1970
73.85
+4.761
6.89%
jan 1, 1971
71.552
-2.298
-3.11%
jan 1, 1972
69.947
-1.605
-2.24%
jan 1, 1973
71.494
+1.548
2.21%
jan 1, 1974
67.501
-3.994
-5.59%
jan 1, 1975
80.167
+12.666
18.76%
jan 1, 1976
87.86
+7.693
9.6%
jan 1, 1977
81.63
-6.23
-7.09%
jan 1, 1978
85.21
+3.58
4.39%
jan 1, 1979
85.498
+0.288
0.34%
jan 1, 1980
87.276
+1.777
2.08%
jan 1, 1981
93.71
+6.434
7.37%
jan 1, 1982
85.947
-7.762
-8.28%
jan 1, 1983
89.477
+3.529
4.11%
jan 1, 1984
83.742
-5.734
-6.41%
jan 1, 1985
85.556
+1.814
2.17%
jan 1, 1986
79.115
-6.441
-7.53%
jan 1, 1987
82.069
+2.954
3.73%
jan 1, 1988
80.612
-1.457
-1.78%
jan 1, 1989
80.668
+0.056
0.07%
jan 1, 1990
78.602
-2.065
-2.56%
jan 1, 1991
80.72
+2.118
2.69%
jan 1, 1992
79.258
-1.462
-1.81%
jan 1, 1993
79.969
+0.711
0.9%
jan 1, 1994
79.961
-0.008
-0.01%
jan 1, 1995
73.429
-6.531
-8.17%
jan 1, 1996
77.002
+3.572
4.86%
jan 1, 1997
83.962
+6.96
9.04%
jan 1, 1998
80.116
-3.846
-4.58%
jan 1, 1999
83.263
+3.147
3.93%
jan 1, 2000
74.82
-8.443
-10.14%
jan 1, 2001
77.559
+2.739
3.66%
jan 1, 2002
81.165
+3.606
4.65%
jan 1, 2003
80.729
-0.436
-0.54%
jan 1, 2004
82.997
+2.268
2.81%
jan 1, 2005
88.003
+5.007
6.03%
jan 1, 2006
89.871
+1.867
2.12%
jan 1, 2007
90.672
+0.801
0.89%
jan 1, 2008
92.299
+1.627
1.79%
jan 1, 2009
92.649
+0.351
0.38%
jan 1, 2010
91.921
-0.728
-0.79%
jan 1, 2011
92.207
+0.286
0.31%
jan 1, 2012
87.706
-4.501
-4.88%
jan 1, 2013
88.051
+0.345
0.39%
jan 1, 2014
91.626
+3.576
4.06%
jan 1, 2015
106.124
+14.498
15.82%
jan 1, 2016
100.368
-5.756
-5.42%
Ranking of countries by current statistics by years


Comments: