29
/
en
AIzaSyAYiBZKx7MnpbEhh9jyipgxe19OcubqV5w
April 1, 2024
264699
Togo
TGO
true
2
1
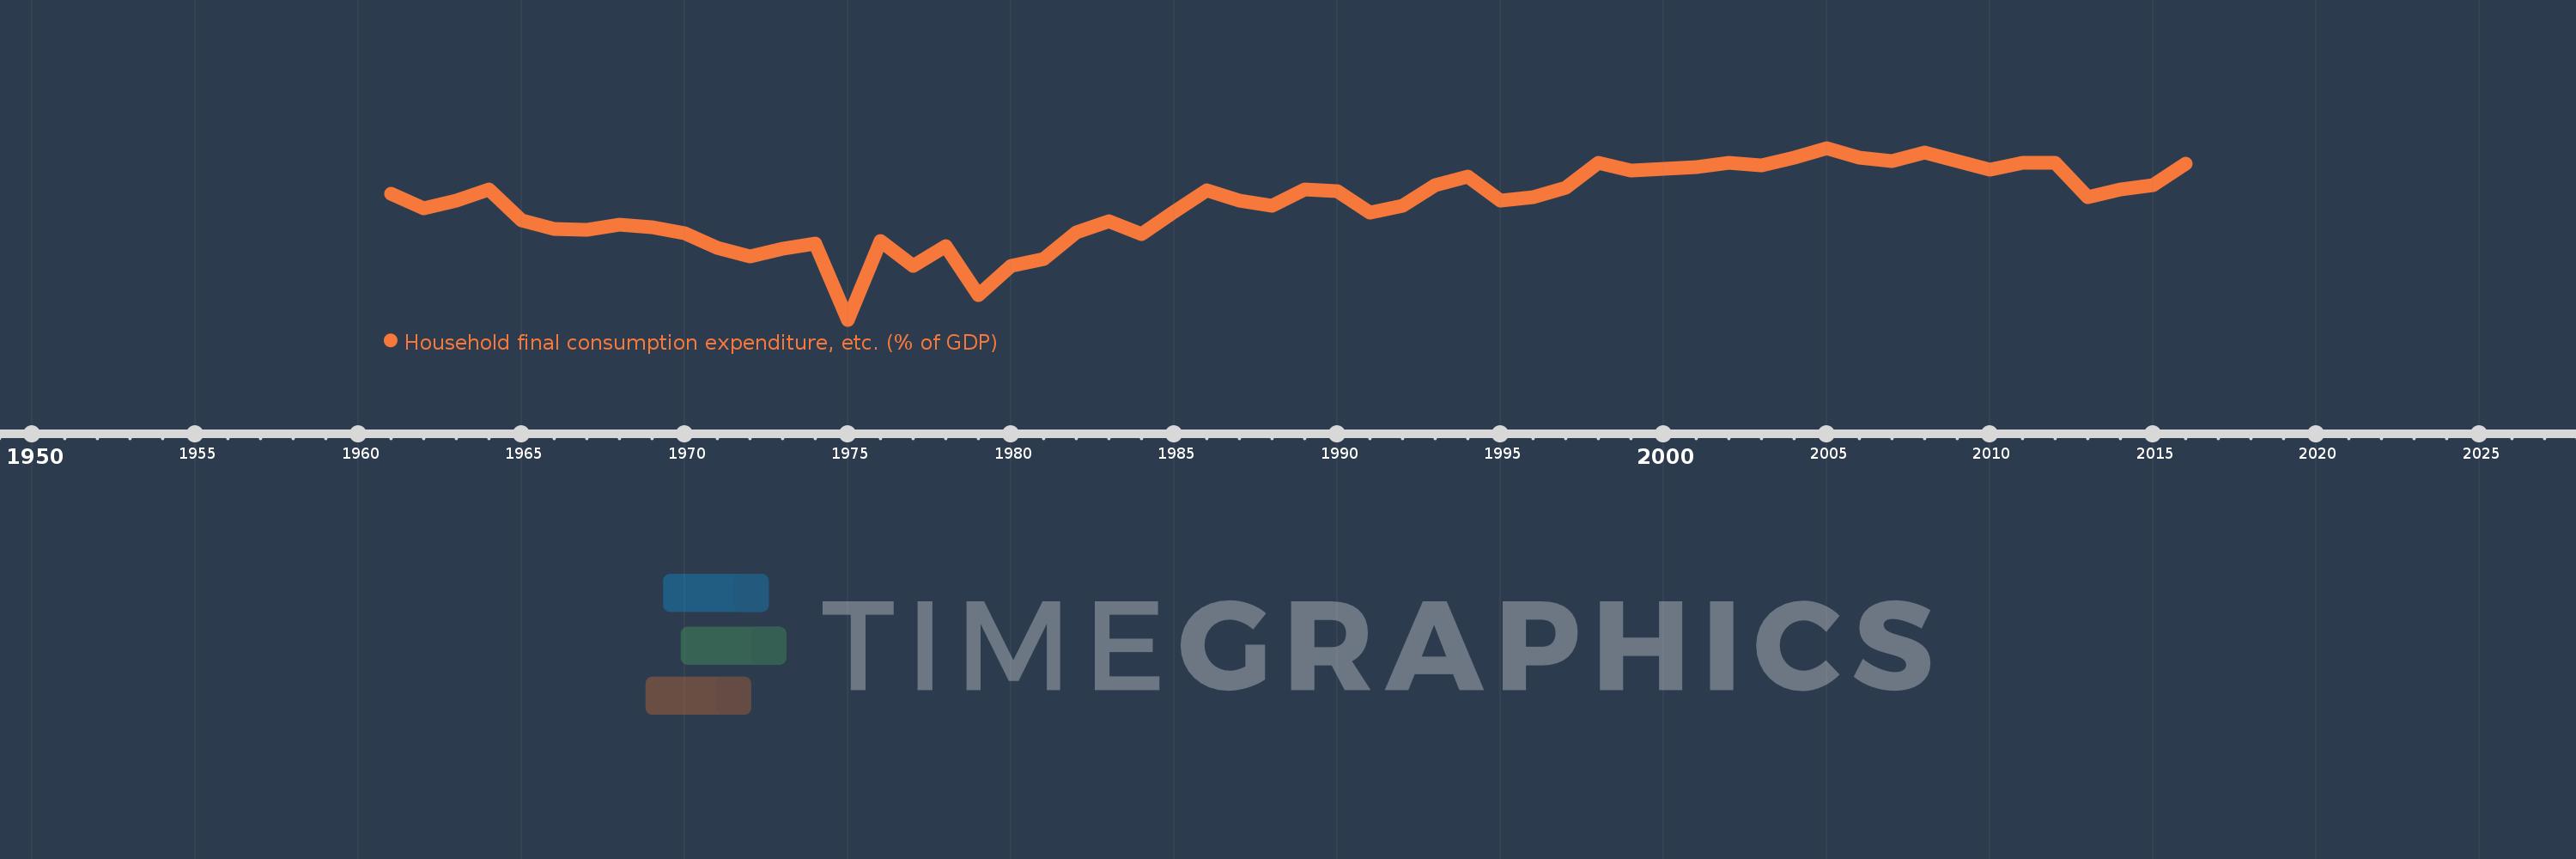
Household final consumption expenditure, etc. (% of GDP)
2016,2015,2014,2013,2012,2011,2010,2008,2007,2006,2005,2004,2003,2002,2001,2000,1999,1998,1997,1996,1995,1994,1993,1992,1991,1990,1989,1988,1987,1986,1985,1984,1983,1982,1981,1980,1979,1978,1977,1976,1975,1974,1973,1972,1971,1970,1969,1968,1967,1966,1965,1964,1963,1962,1961
This statistics in other country:
AfghanistanAlbaniaAlgeriaAngolaAntigua and BarbudaArab WorldArgentinaArmeniaArubaAustraliaAustriaAzerbaijanBahamas, TheBahrainBangladeshBarbadosBelarusBelgiumBelizeBeninBermudaBhutanBoliviaBosnia and HerzegovinaBotswanaBrazilBrunei DarussalamBulgariaBurkina FasoBurundiCabo VerdeCambodiaCameroonCanadaCaribbean small statesCentral African RepublicCentral Europe and the BalticsChadChileChinaColombiaComorosCongo, Dem. Rep.Congo, Rep.Costa RicaCote d'IvoireCroatiaCubaCyprusCzech RepublicDenmarkDjiboutiDominicaDominican RepublicEarly-demographic dividendEast Asia & PacificEast Asia & Pacific (excluding high income)East Asia & Pacific (IDA & IBRD countries)EcuadorEgypt, Arab Rep.El SalvadorEquatorial GuineaEritreaEstoniaEthiopiaEuro areaEurope & Central AsiaEurope & Central Asia (excluding high income)Europe & Central Asia (IDA & IBRD countries)European UnionFaroe IslandsFijiFinlandFragile and conflict affected situationsFranceGabonGambia, TheGeorgiaGermanyGhanaGreeceGrenadaGuatemalaGuineaGuinea-BissauGuyanaHaitiHeavily indebted poor countries (HIPC)High incomeHondurasHong Kong SAR, ChinaHungaryIBRD onlyIcelandIDA & IBRD totalIDA blendIDA onlyIDA totalIndiaIndonesiaIran, Islamic Rep.IraqIrelandIsraelItalyJamaicaJapanJordanKazakhstanKenyaKiribatiKorea, Rep.KosovoKuwaitKyrgyz RepublicLao PDRLate-demographic dividendLatin America & Caribbean Latin America & Caribbean (excluding high income)Latin America & the Caribbean (IDA & IBRD countries)LatviaLeast developed countries: UN classificationLebanonLesothoLiberiaLibyaLithuaniaLow & middle incomeLow incomeLower middle incomeLuxembourgMacao SAR, ChinaMacedonia, FYRMadagascarMalawiMalaysiaMaldivesMaliMaltaMauritaniaMauritiusMexicoMicronesia, Fed. Sts.Middle East & North AfricaMiddle East & North Africa (excluding high income)Middle East & North Africa (IDA & IBRD countries)Middle incomeMoldovaMongoliaMontenegroMoroccoMozambiqueNamibiaNepalNetherlandsNew CaledoniaNew ZealandNicaraguaNigerNigeriaNorth AmericaNorwayOECD membersOmanOther small statesPacific island small statesPakistanPanamaPapua New GuineaParaguayPeruPhilippinesPolandPortugalPost-demographic dividendPre-demographic dividendPuerto RicoQatarRomaniaRussian FederationRwandaSaudi ArabiaSenegalSerbiaSeychellesSierra LeoneSingaporeSlovak RepublicSloveniaSmall statesSolomon IslandsSomaliaSouth AfricaSouth AsiaSouth Asia (IDA & IBRD)South SudanSpainSri LankaSt. Kitts and NevisSt. LuciaSt. Vincent and the GrenadinesSub-Saharan Africa Sub-Saharan Africa (excluding high income)Sub-Saharan Africa (IDA & IBRD countries)SudanSurinameSwazilandSwedenSwitzerlandSyrian Arab RepublicTajikistanTanzaniaThailandTimor-LesteTogoTongaTrinidad and TobagoTunisiaTurkeyTurkmenistanUgandaUkraineUnited Arab EmiratesUnited KingdomUnited StatesUpper middle incomeUruguayUzbekistanVanuatuVenezuela, RBVietnamWest Bank and GazaWorldYemen, Rep.ZambiaZimbabwe Timeline:
This timeline shows a graph from 1961 to 2016 of Togo. No data until 1960. Number of actual observations by date: 55.
Source name:
World Development Indicators
Source organization:
World Bank national accounts data, and OECD National Accounts data files.
Categories, topics:
Economy & Growth
Last updated:
apr 23, 2017
Indicators value changes by year
Minimum:
32.413
jan 1, 1975
Maximum:
94.461
jan 1, 2005
At the date of observation
Value
Absolute change
Change from previous value
jan 1, 1961
77.879
+77.879
0.0%
jan 1, 1962
72.586
-5.294
-6.8%
jan 1, 1963
75.307
+2.721
3.75%
jan 1, 1964
79.55
+4.243
5.63%
jan 1, 1965
68.198
-11.351
-14.27%
jan 1, 1966
65.284
-2.915
-4.27%
jan 1, 1967
64.967
-0.316
-0.48%
jan 1, 1968
66.812
+1.844
2.84%
jan 1, 1969
65.824
-0.987
-1.48%
jan 1, 1970
63.775
-2.049
-3.11%
jan 1, 1971
58.285
-5.49
-8.61%
jan 1, 1972
55.216
-3.069
-5.27%
jan 1, 1973
58.181
+2.965
5.37%
jan 1, 1974
59.805
+1.624
2.79%
jan 1, 1975
32.413
-27.392
-45.8%
jan 1, 1976
60.915
+28.502
87.93%
jan 1, 1977
51.92
-8.995
-14.77%
jan 1, 1978
58.847
+6.927
13.34%
jan 1, 1979
41.398
-17.449
-29.65%
jan 1, 1980
51.95
+10.552
25.49%
jan 1, 1981
54.477
+2.527
4.86%
jan 1, 1982
63.824
+9.347
17.16%
jan 1, 1983
68.074
+4.25
6.66%
jan 1, 1984
63.434
-4.64
-6.82%
jan 1, 1985
71.319
+7.885
12.43%
jan 1, 1986
79.016
+7.697
10.79%
jan 1, 1987
75.318
-3.698
-4.68%
jan 1, 1988
73.703
-1.616
-2.15%
jan 1, 1989
79.444
+5.741
7.79%
jan 1, 1990
78.893
-0.551
-0.69%
jan 1, 1991
71.09
-7.803
-9.89%
jan 1, 1992
73.456
+2.366
3.33%
jan 1, 1993
81.133
+7.677
10.45%
jan 1, 1994
84.144
+3.011
3.71%
jan 1, 1995
75.508
-8.636
-10.26%
jan 1, 1996
76.721
+1.213
1.61%
jan 1, 1997
80.071
+3.35
4.37%
jan 1, 1998
89.245
+9.174
11.46%
jan 1, 1999
86.318
-2.927
-3.28%
jan 1, 2000
87.072
+0.755
0.87%
jan 1, 2001
87.592
+0.519
0.6%
jan 1, 2002
89.056
+1.464
1.67%
jan 1, 2003
88.023
-1.033
-1.16%
jan 1, 2004
90.998
+2.975
3.38%
jan 1, 2005
94.461
+3.463
3.81%
jan 1, 2006
90.83
-3.631
-3.84%
jan 1, 2007
89.714
-1.116
-1.23%
jan 1, 2008
92.753
+3.039
3.39%
jan 1, 2010
86.484
-6.27
-6.76%
jan 1, 2011
89.167
+2.683
3.1%
jan 1, 2012
89.063
-0.103
-0.12%
jan 1, 2013
76.737
-12.326
-13.84%
jan 1, 2014
79.556
+2.818
3.67%
jan 1, 2015
81.06
+1.504
1.89%
jan 1, 2016
88.743
+7.683
9.48%
Ranking of countries by current statistics by years


Comments: