29
/
en
AIzaSyAYiBZKx7MnpbEhh9jyipgxe19OcubqV5w
April 1, 2024
52681
OECD members
OED
false
2
1
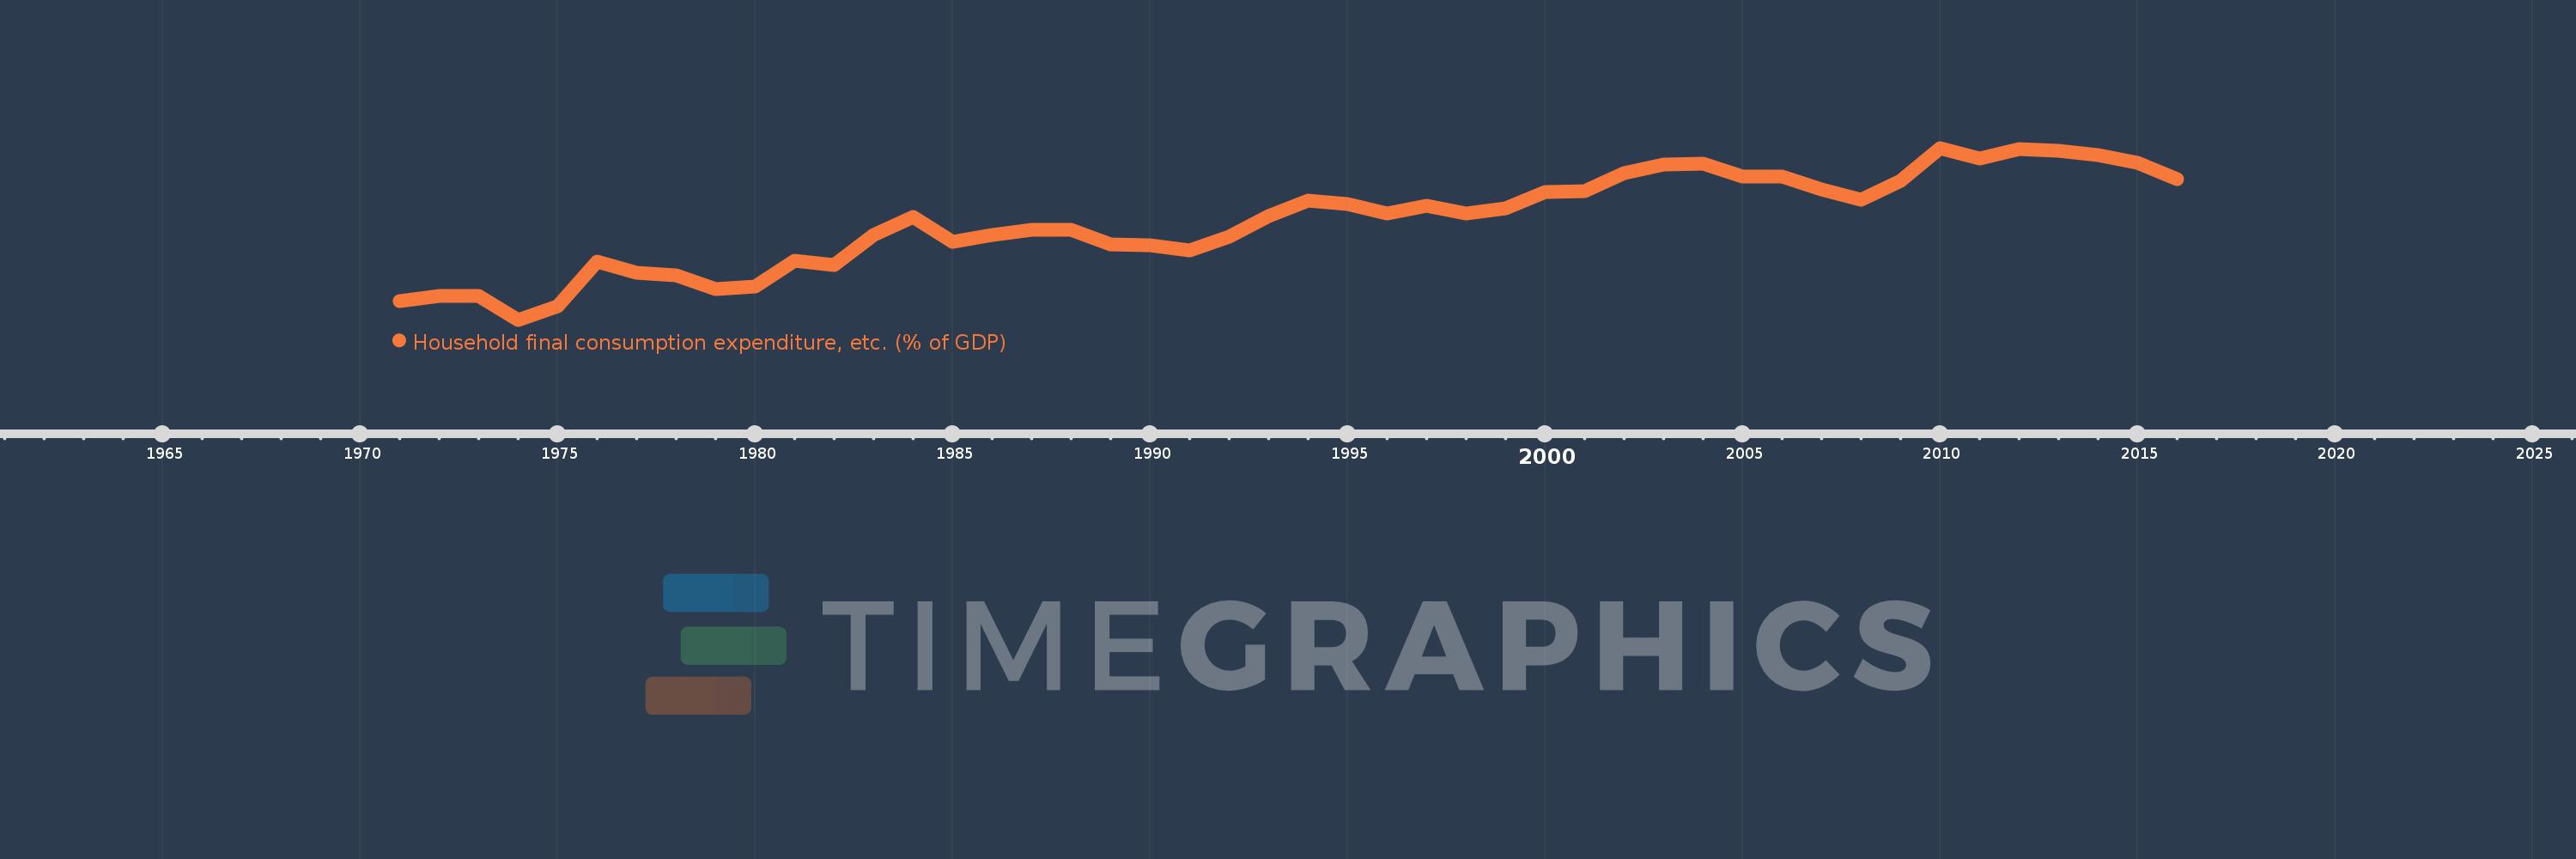
Household final consumption expenditure, etc. (% of GDP)
2016,2015,2014,2013,2012,2011,2010,2009,2008,2007,2006,2005,2004,2003,2002,2001,2000,1999,1998,1997,1996,1995,1994,1993,1992,1991,1990,1989,1988,1987,1986,1985,1984,1983,1982,1981,1980,1979,1978,1977,1976,1975,1974,1973,1972,1971
This statistics in other country:
AfghanistanAlbaniaAlgeriaAngolaAntigua and BarbudaArab WorldArgentinaArmeniaArubaAustraliaAustriaAzerbaijanBahamas, TheBahrainBangladeshBarbadosBelarusBelgiumBelizeBeninBermudaBhutanBoliviaBosnia and HerzegovinaBotswanaBrazilBrunei DarussalamBulgariaBurkina FasoBurundiCabo VerdeCambodiaCameroonCanadaCaribbean small statesCentral African RepublicCentral Europe and the BalticsChadChileChinaColombiaComorosCongo, Dem. Rep.Congo, Rep.Costa RicaCote d'IvoireCroatiaCubaCyprusCzech RepublicDenmarkDjiboutiDominicaDominican RepublicEarly-demographic dividendEast Asia & PacificEast Asia & Pacific (excluding high income)East Asia & Pacific (IDA & IBRD countries)EcuadorEgypt, Arab Rep.El SalvadorEquatorial GuineaEritreaEstoniaEthiopiaEuro areaEurope & Central AsiaEurope & Central Asia (excluding high income)Europe & Central Asia (IDA & IBRD countries)European UnionFaroe IslandsFijiFinlandFragile and conflict affected situationsFranceGabonGambia, TheGeorgiaGermanyGhanaGreeceGrenadaGuatemalaGuineaGuinea-BissauGuyanaHaitiHeavily indebted poor countries (HIPC)High incomeHondurasHong Kong SAR, ChinaHungaryIBRD onlyIcelandIDA & IBRD totalIDA blendIDA onlyIDA totalIndiaIndonesiaIran, Islamic Rep.IraqIrelandIsraelItalyJamaicaJapanJordanKazakhstanKenyaKiribatiKorea, Rep.KosovoKuwaitKyrgyz RepublicLao PDRLate-demographic dividendLatin America & Caribbean Latin America & Caribbean (excluding high income)Latin America & the Caribbean (IDA & IBRD countries)LatviaLeast developed countries: UN classificationLebanonLesothoLiberiaLibyaLithuaniaLow & middle incomeLow incomeLower middle incomeLuxembourgMacao SAR, ChinaMacedonia, FYRMadagascarMalawiMalaysiaMaldivesMaliMaltaMauritaniaMauritiusMexicoMicronesia, Fed. Sts.Middle East & North AfricaMiddle East & North Africa (excluding high income)Middle East & North Africa (IDA & IBRD countries)Middle incomeMoldovaMongoliaMontenegroMoroccoMozambiqueNamibiaNepalNetherlandsNew CaledoniaNew ZealandNicaraguaNigerNigeriaNorth AmericaNorwayOECD membersOmanOther small statesPacific island small statesPakistanPanamaPapua New GuineaParaguayPeruPhilippinesPolandPortugalPost-demographic dividendPre-demographic dividendPuerto RicoQatarRomaniaRussian FederationRwandaSaudi ArabiaSenegalSerbiaSeychellesSierra LeoneSingaporeSlovak RepublicSloveniaSmall statesSolomon IslandsSomaliaSouth AfricaSouth AsiaSouth Asia (IDA & IBRD)South SudanSpainSri LankaSt. Kitts and NevisSt. LuciaSt. Vincent and the GrenadinesSub-Saharan Africa Sub-Saharan Africa (excluding high income)Sub-Saharan Africa (IDA & IBRD countries)SudanSurinameSwazilandSwedenSwitzerlandSyrian Arab RepublicTajikistanTanzaniaThailandTimor-LesteTogoTongaTrinidad and TobagoTunisiaTurkeyTurkmenistanUgandaUkraineUnited Arab EmiratesUnited KingdomUnited StatesUpper middle incomeUruguayUzbekistanVanuatuVenezuela, RBVietnamWest Bank and GazaWorldYemen, Rep.ZambiaZimbabwe Timeline:
This timeline shows a graph from 1971 to 2016 of OECD members. No data until 1970. Number of actual observations by date: 46.
Source name:
World Development Indicators
Source organization:
World Bank national accounts data, and OECD National Accounts data files.
Categories, topics:
Economy & Growth
Last updated:
apr 23, 2017
Indicators value changes by year
Minimum:
57.412
jan 1, 1974
Maximum:
61.459
jan 1, 2010
At the date of observation
Value
Absolute change
Change from previous value
jan 1, 1971
57.861
+57.861
0.0%
jan 1, 1972
57.966
+0.105
0.18%
jan 1, 1973
57.967
+0.001
0.0%
jan 1, 1974
57.412
-0.555
-0.96%
jan 1, 1975
57.721
+0.309
0.54%
jan 1, 1976
58.787
+1.067
1.85%
jan 1, 1977
58.514
-0.273
-0.46%
jan 1, 1978
58.466
-0.048
-0.08%
jan 1, 1979
58.128
-0.338
-0.58%
jan 1, 1980
58.2
+0.073
0.13%
jan 1, 1981
58.793
+0.593
1.02%
jan 1, 1982
58.708
-0.085
-0.15%
jan 1, 1983
59.418
+0.71
1.21%
jan 1, 1984
59.831
+0.413
0.69%
jan 1, 1985
59.246
-0.585
-0.98%
jan 1, 1986
59.415
+0.17
0.29%
jan 1, 1987
59.54
+0.125
0.21%
jan 1, 1988
59.531
-0.009
-0.02%
jan 1, 1989
59.191
-0.34
-0.57%
jan 1, 1990
59.157
-0.035
-0.06%
jan 1, 1991
59.045
-0.112
-0.19%
jan 1, 1992
59.377
+0.332
0.56%
jan 1, 1993
59.86
+0.483
0.81%
jan 1, 1994
60.216
+0.356
0.59%
jan 1, 1995
60.145
-0.07
-0.12%
jan 1, 1996
59.916
-0.229
-0.38%
jan 1, 1997
60.095
+0.179
0.3%
jan 1, 1998
59.92
-0.176
-0.29%
jan 1, 1999
60.038
+0.118
0.2%
jan 1, 2000
60.418
+0.381
0.63%
jan 1, 2001
60.445
+0.026
0.04%
jan 1, 2002
60.871
+0.426
0.7%
jan 1, 2003
61.066
+0.195
0.32%
jan 1, 2004
61.09
+0.024
0.04%
jan 1, 2005
60.779
-0.311
-0.51%
jan 1, 2006
60.784
+0.004
0.01%
jan 1, 2007
60.489
-0.295
-0.49%
jan 1, 2008
60.245
-0.244
-0.4%
jan 1, 2009
60.682
+0.437
0.73%
jan 1, 2010
61.459
+0.777
1.28%
jan 1, 2011
61.208
-0.251
-0.41%
jan 1, 2012
61.433
+0.224
0.37%
jan 1, 2013
61.387
-0.046
-0.07%
jan 1, 2014
61.282
-0.105
-0.17%
jan 1, 2015
61.108
-0.175
-0.28%
jan 1, 2016
60.723
-0.385
-0.63%
Ranking of countries by current statistics by years


Comments: