29
/
en
AIzaSyAYiBZKx7MnpbEhh9jyipgxe19OcubqV5w
April 1, 2024
134207
France
FRA
true
2
1
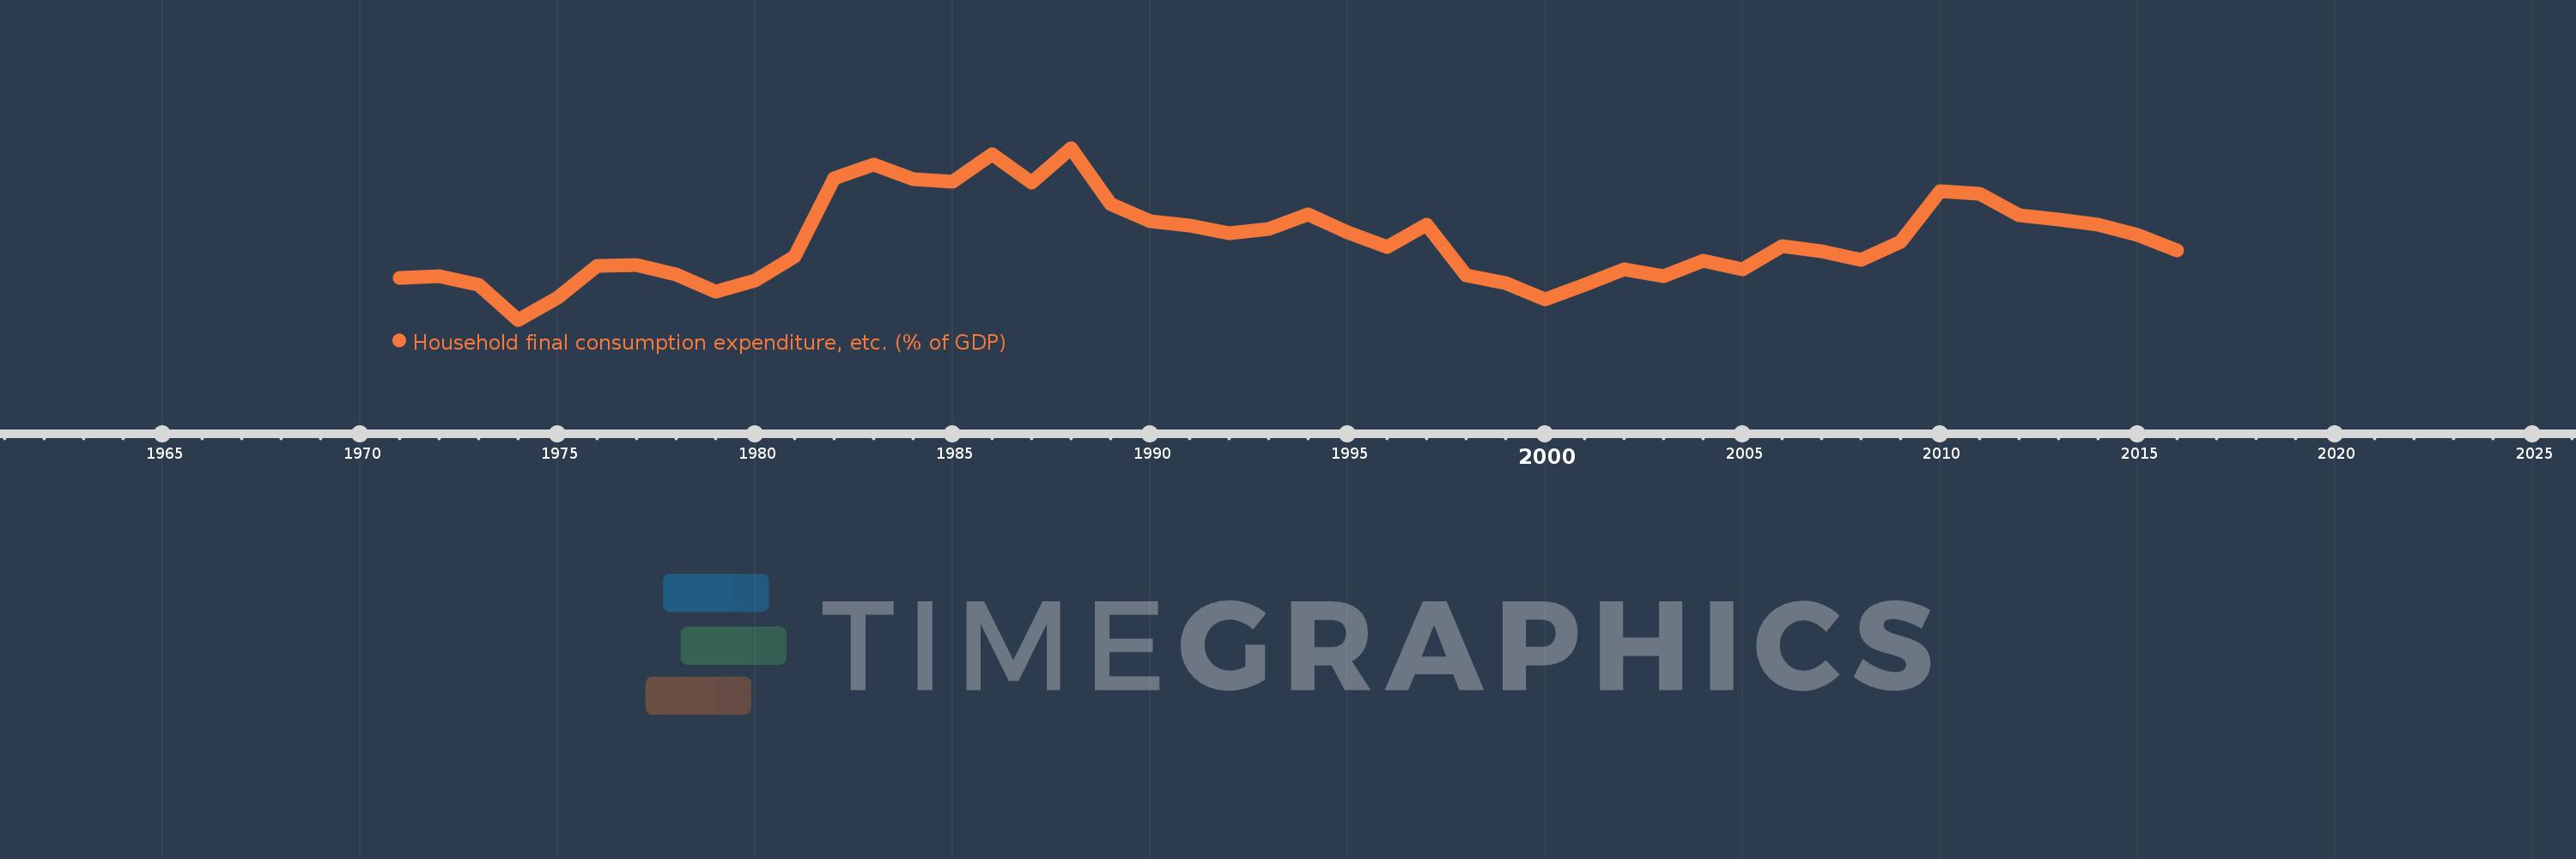
Household final consumption expenditure, etc. (% of GDP)
2016,2015,2014,2013,2012,2011,2010,2009,2008,2007,2006,2005,2004,2003,2002,2001,2000,1999,1998,1997,1996,1995,1994,1993,1992,1991,1990,1989,1988,1987,1986,1985,1984,1983,1982,1981,1980,1979,1978,1977,1976,1975,1974,1973,1972,1971
This statistics in other country:
AfghanistanAlbaniaAlgeriaAngolaAntigua and BarbudaArab WorldArgentinaArmeniaArubaAustraliaAustriaAzerbaijanBahamas, TheBahrainBangladeshBarbadosBelarusBelgiumBelizeBeninBermudaBhutanBoliviaBosnia and HerzegovinaBotswanaBrazilBrunei DarussalamBulgariaBurkina FasoBurundiCabo VerdeCambodiaCameroonCanadaCaribbean small statesCentral African RepublicCentral Europe and the BalticsChadChileChinaColombiaComorosCongo, Dem. Rep.Congo, Rep.Costa RicaCote d'IvoireCroatiaCubaCyprusCzech RepublicDenmarkDjiboutiDominicaDominican RepublicEarly-demographic dividendEast Asia & PacificEast Asia & Pacific (excluding high income)East Asia & Pacific (IDA & IBRD countries)EcuadorEgypt, Arab Rep.El SalvadorEquatorial GuineaEritreaEstoniaEthiopiaEuro areaEurope & Central AsiaEurope & Central Asia (excluding high income)Europe & Central Asia (IDA & IBRD countries)European UnionFaroe IslandsFijiFinlandFragile and conflict affected situationsFranceGabonGambia, TheGeorgiaGermanyGhanaGreeceGrenadaGuatemalaGuineaGuinea-BissauGuyanaHaitiHeavily indebted poor countries (HIPC)High incomeHondurasHong Kong SAR, ChinaHungaryIBRD onlyIcelandIDA & IBRD totalIDA blendIDA onlyIDA totalIndiaIndonesiaIran, Islamic Rep.IraqIrelandIsraelItalyJamaicaJapanJordanKazakhstanKenyaKiribatiKorea, Rep.KosovoKuwaitKyrgyz RepublicLao PDRLate-demographic dividendLatin America & Caribbean Latin America & Caribbean (excluding high income)Latin America & the Caribbean (IDA & IBRD countries)LatviaLeast developed countries: UN classificationLebanonLesothoLiberiaLibyaLithuaniaLow & middle incomeLow incomeLower middle incomeLuxembourgMacao SAR, ChinaMacedonia, FYRMadagascarMalawiMalaysiaMaldivesMaliMaltaMauritaniaMauritiusMexicoMicronesia, Fed. Sts.Middle East & North AfricaMiddle East & North Africa (excluding high income)Middle East & North Africa (IDA & IBRD countries)Middle incomeMoldovaMongoliaMontenegroMoroccoMozambiqueNamibiaNepalNetherlandsNew CaledoniaNew ZealandNicaraguaNigerNigeriaNorth AmericaNorwayOECD membersOmanOther small statesPacific island small statesPakistanPanamaPapua New GuineaParaguayPeruPhilippinesPolandPortugalPost-demographic dividendPre-demographic dividendPuerto RicoQatarRomaniaRussian FederationRwandaSaudi ArabiaSenegalSerbiaSeychellesSierra LeoneSingaporeSlovak RepublicSloveniaSmall statesSolomon IslandsSomaliaSouth AfricaSouth AsiaSouth Asia (IDA & IBRD)South SudanSpainSri LankaSt. Kitts and NevisSt. LuciaSt. Vincent and the GrenadinesSub-Saharan Africa Sub-Saharan Africa (excluding high income)Sub-Saharan Africa (IDA & IBRD countries)SudanSurinameSwazilandSwedenSwitzerlandSyrian Arab RepublicTajikistanTanzaniaThailandTimor-LesteTogoTongaTrinidad and TobagoTunisiaTurkeyTurkmenistanUgandaUkraineUnited Arab EmiratesUnited KingdomUnited StatesUpper middle incomeUruguayUzbekistanVanuatuVenezuela, RBVietnamWest Bank and GazaWorldYemen, Rep.ZambiaZimbabwe Timeline:
This timeline shows a graph from 1971 to 2016 of France. No data until 1970. Number of actual observations by date: 46.
Source name:
World Development Indicators
Source organization:
World Bank national accounts data, and OECD National Accounts data files.
Categories, topics:
Economy & Growth
Last updated:
apr 23, 2017
Indicators value changes by year
Minimum:
53.793
jan 1, 1974
Maximum:
57.007
jan 1, 1988
At the date of observation
Value
Absolute change
Change from previous value
jan 1, 1971
54.579
+54.579
0.0%
jan 1, 1972
54.605
+0.026
0.05%
jan 1, 1973
54.455
-0.15
-0.27%
jan 1, 1974
53.793
-0.662
-1.22%
jan 1, 1975
54.203
+0.411
0.76%
jan 1, 1976
54.794
+0.59
1.09%
jan 1, 1977
54.818
+0.024
0.04%
jan 1, 1978
54.643
-0.174
-0.32%
jan 1, 1979
54.322
-0.321
-0.59%
jan 1, 1980
54.522
+0.2
0.37%
jan 1, 1981
54.982
+0.46
0.84%
jan 1, 1982
56.444
+1.462
2.66%
jan 1, 1983
56.697
+0.253
0.45%
jan 1, 1984
56.416
-0.281
-0.5%
jan 1, 1985
56.372
-0.043
-0.08%
jan 1, 1986
56.895
+0.522
0.93%
jan 1, 1987
56.355
-0.54
-0.95%
jan 1, 1988
57.007
+0.653
1.16%
jan 1, 1989
55.957
-1.05
-1.84%
jan 1, 1990
55.629
-0.328
-0.59%
jan 1, 1991
55.555
-0.074
-0.13%
jan 1, 1992
55.415
-0.139
-0.25%
jan 1, 1993
55.497
+0.081
0.15%
jan 1, 1994
55.77
+0.274
0.49%
jan 1, 1995
55.426
-0.344
-0.62%
jan 1, 1996
55.159
-0.267
-0.48%
jan 1, 1997
55.579
+0.419
0.76%
jan 1, 1998
54.622
-0.957
-1.72%
jan 1, 1999
54.487
-0.135
-0.25%
jan 1, 2000
54.173
-0.314
-0.58%
jan 1, 2001
54.443
+0.269
0.5%
jan 1, 2002
54.736
+0.294
0.54%
jan 1, 2003
54.603
-0.133
-0.24%
jan 1, 2004
54.89
+0.286
0.52%
jan 1, 2005
54.741
-0.149
-0.27%
jan 1, 2006
55.168
+0.427
0.78%
jan 1, 2007
55.081
-0.087
-0.16%
jan 1, 2008
54.912
-0.169
-0.31%
jan 1, 2009
55.254
+0.342
0.62%
jan 1, 2010
56.194
+0.94
1.7%
jan 1, 2011
56.143
-0.05
-0.09%
jan 1, 2012
55.744
-0.399
-0.71%
jan 1, 2013
55.667
-0.077
-0.14%
jan 1, 2014
55.577
-0.09
-0.16%
jan 1, 2015
55.382
-0.195
-0.35%
jan 1, 2016
55.09
-0.293
-0.53%
Ranking of countries by current statistics by years


Comments: