29
/
en
AIzaSyAYiBZKx7MnpbEhh9jyipgxe19OcubqV5w
April 1, 2024
281076
Venezuela, RB
VEN
true
2
1
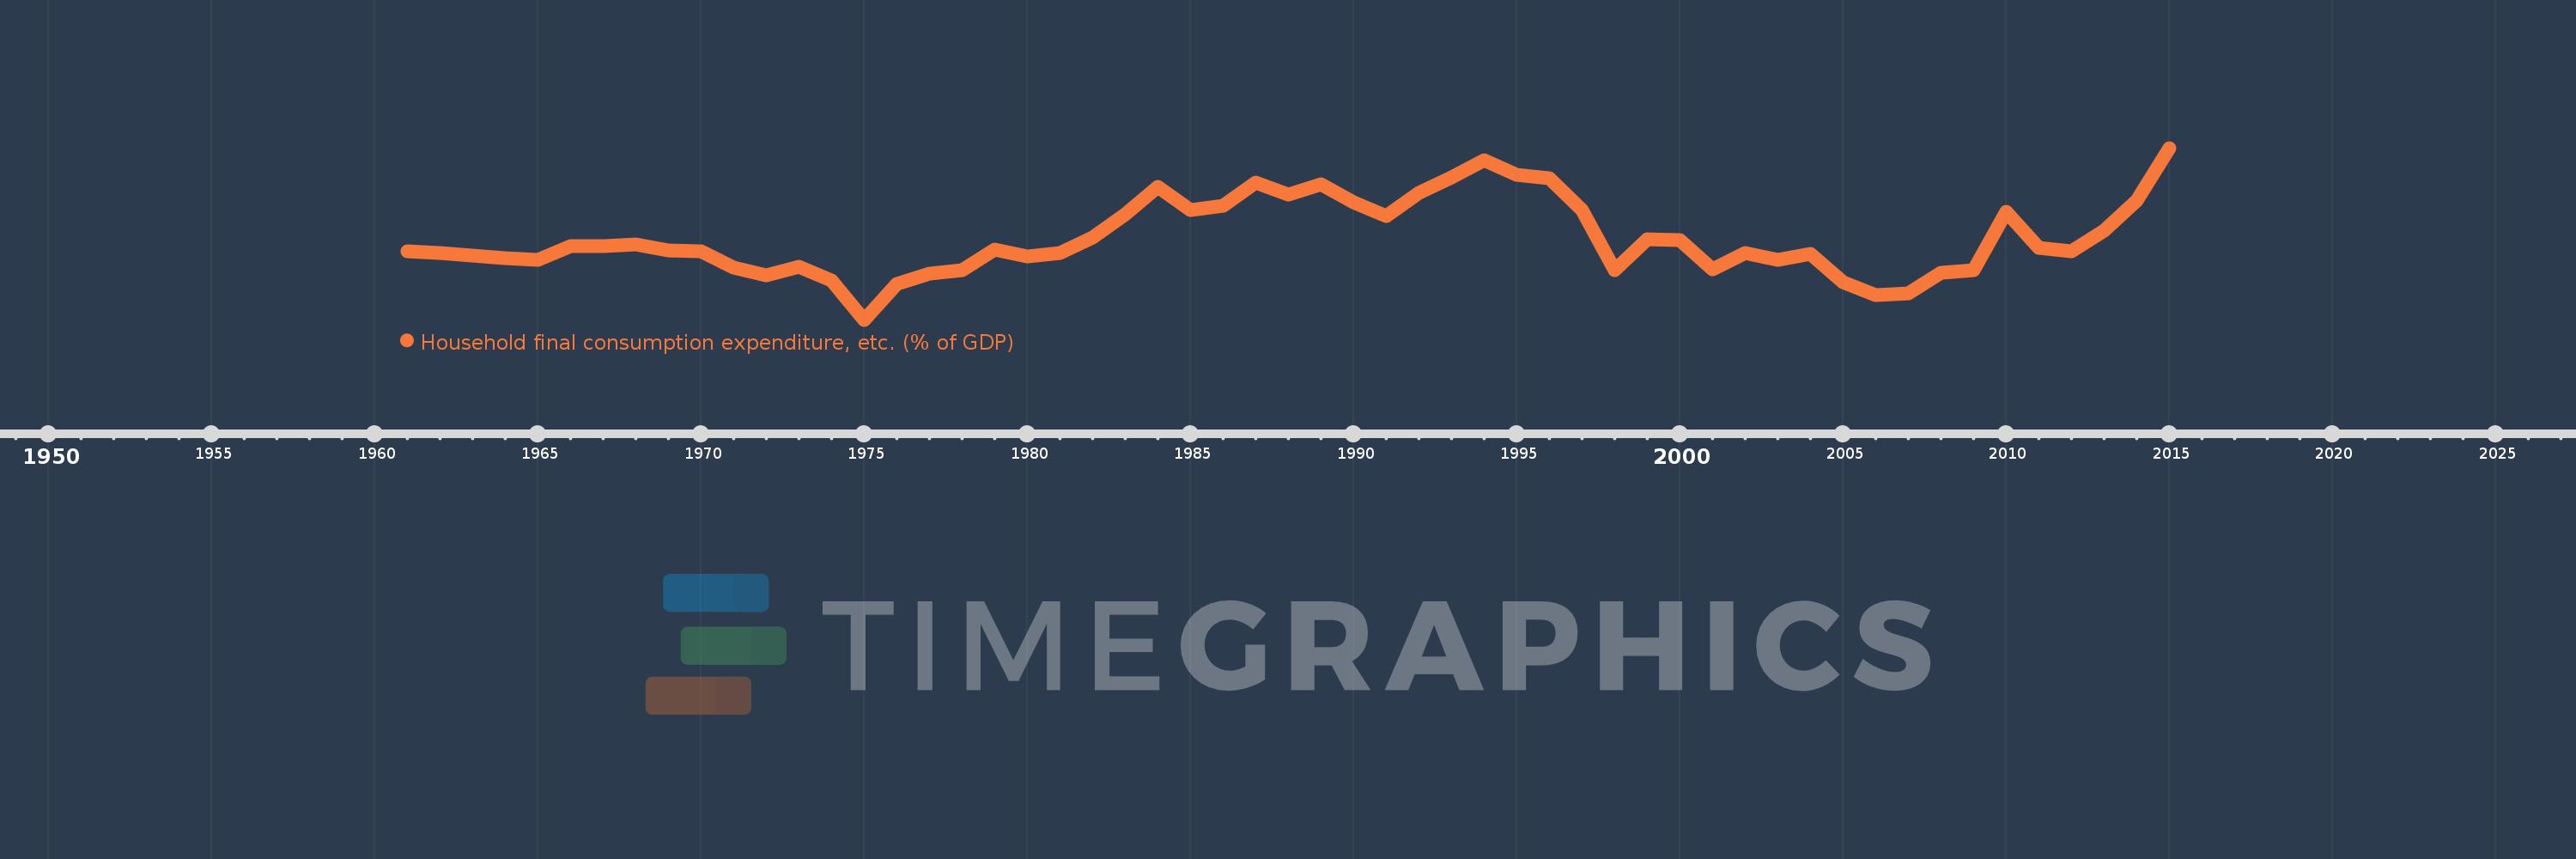
Household final consumption expenditure, etc. (% of GDP)
2015,2014,2013,2012,2011,2010,2009,2008,2007,2006,2005,2004,2003,2002,2001,2000,1999,1998,1997,1996,1995,1994,1993,1992,1991,1990,1989,1988,1987,1986,1985,1984,1983,1982,1981,1980,1979,1978,1977,1976,1975,1974,1973,1972,1971,1970,1969,1968,1967,1966,1965,1964,1963,1962,1961
This statistics in other country:
AfghanistanAlbaniaAlgeriaAngolaAntigua and BarbudaArab WorldArgentinaArmeniaArubaAustraliaAustriaAzerbaijanBahamas, TheBahrainBangladeshBarbadosBelarusBelgiumBelizeBeninBermudaBhutanBoliviaBosnia and HerzegovinaBotswanaBrazilBrunei DarussalamBulgariaBurkina FasoBurundiCabo VerdeCambodiaCameroonCanadaCaribbean small statesCentral African RepublicCentral Europe and the BalticsChadChileChinaColombiaComorosCongo, Dem. Rep.Congo, Rep.Costa RicaCote d'IvoireCroatiaCubaCyprusCzech RepublicDenmarkDjiboutiDominicaDominican RepublicEarly-demographic dividendEast Asia & PacificEast Asia & Pacific (excluding high income)East Asia & Pacific (IDA & IBRD countries)EcuadorEgypt, Arab Rep.El SalvadorEquatorial GuineaEritreaEstoniaEthiopiaEuro areaEurope & Central AsiaEurope & Central Asia (excluding high income)Europe & Central Asia (IDA & IBRD countries)European UnionFaroe IslandsFijiFinlandFragile and conflict affected situationsFranceGabonGambia, TheGeorgiaGermanyGhanaGreeceGrenadaGuatemalaGuineaGuinea-BissauGuyanaHaitiHeavily indebted poor countries (HIPC)High incomeHondurasHong Kong SAR, ChinaHungaryIBRD onlyIcelandIDA & IBRD totalIDA blendIDA onlyIDA totalIndiaIndonesiaIran, Islamic Rep.IraqIrelandIsraelItalyJamaicaJapanJordanKazakhstanKenyaKiribatiKorea, Rep.KosovoKuwaitKyrgyz RepublicLao PDRLate-demographic dividendLatin America & Caribbean Latin America & Caribbean (excluding high income)Latin America & the Caribbean (IDA & IBRD countries)LatviaLeast developed countries: UN classificationLebanonLesothoLiberiaLibyaLithuaniaLow & middle incomeLow incomeLower middle incomeLuxembourgMacao SAR, ChinaMacedonia, FYRMadagascarMalawiMalaysiaMaldivesMaliMaltaMauritaniaMauritiusMexicoMicronesia, Fed. Sts.Middle East & North AfricaMiddle East & North Africa (excluding high income)Middle East & North Africa (IDA & IBRD countries)Middle incomeMoldovaMongoliaMontenegroMoroccoMozambiqueNamibiaNepalNetherlandsNew CaledoniaNew ZealandNicaraguaNigerNigeriaNorth AmericaNorwayOECD membersOmanOther small statesPacific island small statesPakistanPanamaPapua New GuineaParaguayPeruPhilippinesPolandPortugalPost-demographic dividendPre-demographic dividendPuerto RicoQatarRomaniaRussian FederationRwandaSaudi ArabiaSenegalSerbiaSeychellesSierra LeoneSingaporeSlovak RepublicSloveniaSmall statesSolomon IslandsSomaliaSouth AfricaSouth AsiaSouth Asia (IDA & IBRD)South SudanSpainSri LankaSt. Kitts and NevisSt. LuciaSt. Vincent and the GrenadinesSub-Saharan Africa Sub-Saharan Africa (excluding high income)Sub-Saharan Africa (IDA & IBRD countries)SudanSurinameSwazilandSwedenSwitzerlandSyrian Arab RepublicTajikistanTanzaniaThailandTimor-LesteTogoTongaTrinidad and TobagoTunisiaTurkeyTurkmenistanUgandaUkraineUnited Arab EmiratesUnited KingdomUnited StatesUpper middle incomeUruguayUzbekistanVanuatuVenezuela, RBVietnamWest Bank and GazaWorldYemen, Rep.ZambiaZimbabwe Timeline:
This timeline shows a graph from 1961 to 2015 of Venezuela, RB. No data until 1960. Number of actual observations by date: 55.
Source name:
World Development Indicators
Source organization:
World Bank national accounts data, and OECD National Accounts data files.
Categories, topics:
Economy & Growth
Last updated:
apr 23, 2017
Indicators value changes by year
Minimum:
41.925
jan 1, 1975
At the date of observation
Value
Absolute change
Change from previous value
jan 1, 1961
55.197
+55.197
0.0%
jan 1, 1962
54.864
-0.333
-0.6%
jan 1, 1963
54.385
-0.479
-0.87%
jan 1, 1964
53.814
-0.571
-1.05%
jan 1, 1965
53.482
-0.333
-0.62%
jan 1, 1966
56.16
+2.678
5.01%
jan 1, 1967
56.213
+0.054
0.1%
jan 1, 1968
56.478
+0.265
0.47%
jan 1, 1969
55.356
-1.123
-1.99%
jan 1, 1970
55.241
-0.114
-0.21%
jan 1, 1971
52.05
-3.191
-5.78%
jan 1, 1972
50.526
-1.524
-2.93%
jan 1, 1973
52.21
+1.684
3.33%
jan 1, 1974
49.595
-2.614
-5.01%
jan 1, 1975
41.925
-7.67
-15.47%
jan 1, 1976
48.886
+6.96
16.6%
jan 1, 1977
50.808
+1.923
3.93%
jan 1, 1978
51.491
+0.683
1.34%
jan 1, 1979
55.55
+4.059
7.88%
jan 1, 1980
54.266
-1.284
-2.31%
jan 1, 1981
54.869
+0.603
1.11%
jan 1, 1982
57.928
+3.059
5.57%
jan 1, 1983
62.404
+4.477
7.73%
jan 1, 1984
67.65
+5.246
8.41%
jan 1, 1985
63.173
-4.477
-6.62%
jan 1, 1986
63.987
+0.814
1.29%
jan 1, 1987
68.499
+4.512
7.05%
jan 1, 1988
66.282
-2.217
-3.24%
jan 1, 1989
68.274
+1.992
3.0%
jan 1, 1990
64.705
-3.569
-5.23%
jan 1, 1991
62.098
-2.607
-4.03%
jan 1, 1992
66.542
+4.444
7.16%
jan 1, 1993
69.651
+3.108
4.67%
jan 1, 1994
72.927
+3.276
4.7%
jan 1, 1995
70.052
-2.875
-3.94%
jan 1, 1996
69.472
-0.58
-0.83%
jan 1, 1997
63.246
-6.226
-8.96%
jan 1, 1998
51.522
-11.723
-18.54%
jan 1, 1999
57.63
+6.108
11.86%
jan 1, 2000
57.413
-0.217
-0.38%
jan 1, 2001
51.749
-5.664
-9.87%
jan 1, 2002
54.909
+3.16
6.11%
jan 1, 2003
53.542
-1.366
-2.49%
jan 1, 2004
54.782
+1.24
2.32%
jan 1, 2005
49.216
-5.566
-10.16%
jan 1, 2006
46.75
-2.466
-5.01%
jan 1, 2007
46.996
+0.246
0.53%
jan 1, 2008
51.127
+4.131
8.79%
jan 1, 2009
51.502
+0.375
0.73%
jan 1, 2010
62.881
+11.379
22.09%
jan 1, 2011
55.895
-6.986
-11.11%
jan 1, 2012
55.162
-0.733
-1.31%
jan 1, 2013
59.273
+4.111
7.45%
jan 1, 2014
65.09
+5.817
9.81%
jan 1, 2015
75.29
+10.2
15.67%
Ranking of countries by current statistics by years


Comments: