29
/
en
AIzaSyAYiBZKx7MnpbEhh9jyipgxe19OcubqV5w
April 1, 2024
269429
Turkey
TUR
true
2
1
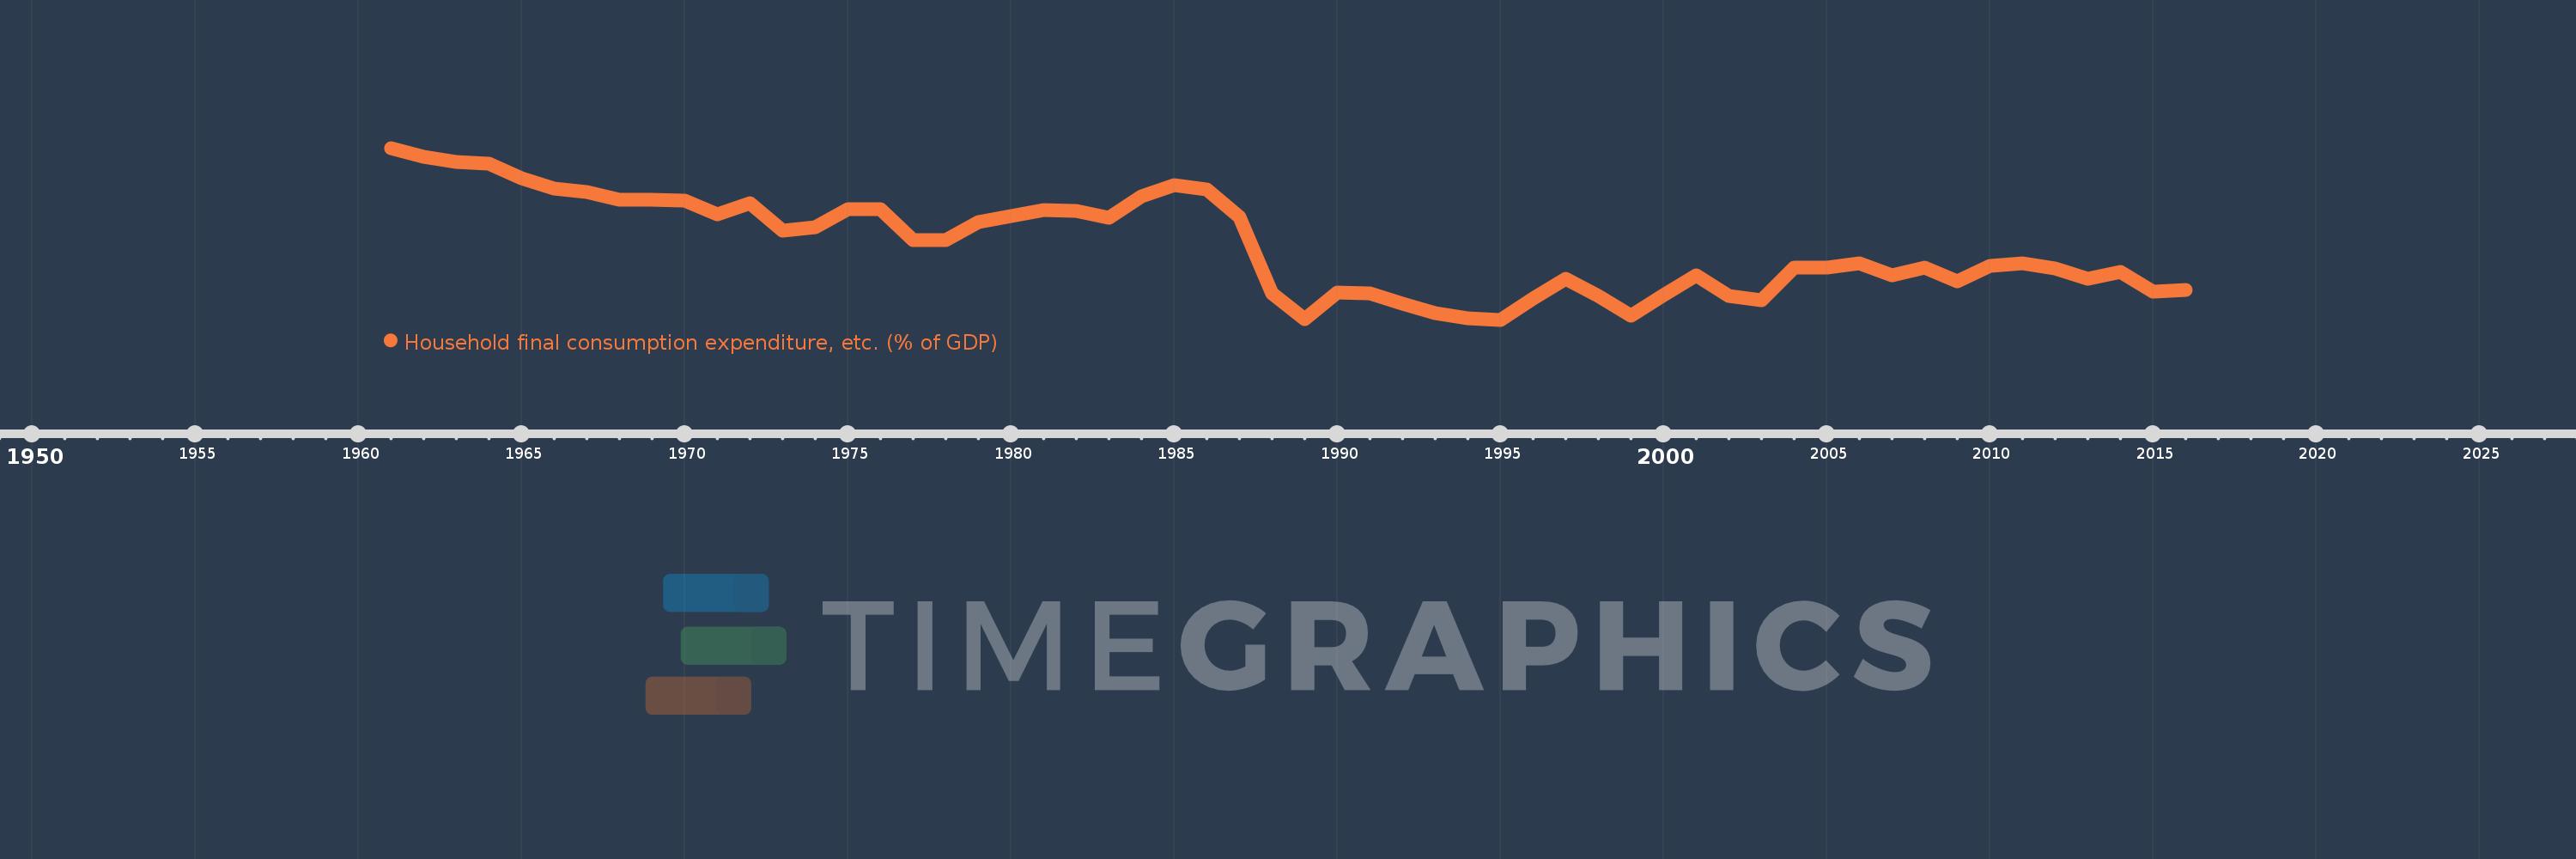
Household final consumption expenditure, etc. (% of GDP)
2016,2015,2014,2013,2012,2011,2010,2009,2008,2007,2006,2005,2004,2003,2002,2001,2000,1999,1998,1997,1996,1995,1994,1993,1992,1991,1990,1989,1988,1987,1986,1985,1984,1983,1982,1981,1980,1979,1978,1977,1976,1975,1974,1973,1972,1971,1970,1969,1968,1967,1966,1965,1964,1963,1962,1961
This statistics in other country:
AfghanistanAlbaniaAlgeriaAngolaAntigua and BarbudaArab WorldArgentinaArmeniaArubaAustraliaAustriaAzerbaijanBahamas, TheBahrainBangladeshBarbadosBelarusBelgiumBelizeBeninBermudaBhutanBoliviaBosnia and HerzegovinaBotswanaBrazilBrunei DarussalamBulgariaBurkina FasoBurundiCabo VerdeCambodiaCameroonCanadaCaribbean small statesCentral African RepublicCentral Europe and the BalticsChadChileChinaColombiaComorosCongo, Dem. Rep.Congo, Rep.Costa RicaCote d'IvoireCroatiaCubaCyprusCzech RepublicDenmarkDjiboutiDominicaDominican RepublicEarly-demographic dividendEast Asia & PacificEast Asia & Pacific (excluding high income)East Asia & Pacific (IDA & IBRD countries)EcuadorEgypt, Arab Rep.El SalvadorEquatorial GuineaEritreaEstoniaEthiopiaEuro areaEurope & Central AsiaEurope & Central Asia (excluding high income)Europe & Central Asia (IDA & IBRD countries)European UnionFaroe IslandsFijiFinlandFragile and conflict affected situationsFranceGabonGambia, TheGeorgiaGermanyGhanaGreeceGrenadaGuatemalaGuineaGuinea-BissauGuyanaHaitiHeavily indebted poor countries (HIPC)High incomeHondurasHong Kong SAR, ChinaHungaryIBRD onlyIcelandIDA & IBRD totalIDA blendIDA onlyIDA totalIndiaIndonesiaIran, Islamic Rep.IraqIrelandIsraelItalyJamaicaJapanJordanKazakhstanKenyaKiribatiKorea, Rep.KosovoKuwaitKyrgyz RepublicLao PDRLate-demographic dividendLatin America & Caribbean Latin America & Caribbean (excluding high income)Latin America & the Caribbean (IDA & IBRD countries)LatviaLeast developed countries: UN classificationLebanonLesothoLiberiaLibyaLithuaniaLow & middle incomeLow incomeLower middle incomeLuxembourgMacao SAR, ChinaMacedonia, FYRMadagascarMalawiMalaysiaMaldivesMaliMaltaMauritaniaMauritiusMexicoMicronesia, Fed. Sts.Middle East & North AfricaMiddle East & North Africa (excluding high income)Middle East & North Africa (IDA & IBRD countries)Middle incomeMoldovaMongoliaMontenegroMoroccoMozambiqueNamibiaNepalNetherlandsNew CaledoniaNew ZealandNicaraguaNigerNigeriaNorth AmericaNorwayOECD membersOmanOther small statesPacific island small statesPakistanPanamaPapua New GuineaParaguayPeruPhilippinesPolandPortugalPost-demographic dividendPre-demographic dividendPuerto RicoQatarRomaniaRussian FederationRwandaSaudi ArabiaSenegalSerbiaSeychellesSierra LeoneSingaporeSlovak RepublicSloveniaSmall statesSolomon IslandsSomaliaSouth AfricaSouth AsiaSouth Asia (IDA & IBRD)South SudanSpainSri LankaSt. Kitts and NevisSt. LuciaSt. Vincent and the GrenadinesSub-Saharan Africa Sub-Saharan Africa (excluding high income)Sub-Saharan Africa (IDA & IBRD countries)SudanSurinameSwazilandSwedenSwitzerlandSyrian Arab RepublicTajikistanTanzaniaThailandTimor-LesteTogoTongaTrinidad and TobagoTunisiaTurkeyTurkmenistanUgandaUkraineUnited Arab EmiratesUnited KingdomUnited StatesUpper middle incomeUruguayUzbekistanVanuatuVenezuela, RBVietnamWest Bank and GazaWorldYemen, Rep.ZambiaZimbabwe Timeline:
This timeline shows a graph from 1961 to 2016 of Turkey. No data until 1960. Number of actual observations by date: 56.
Source name:
World Development Indicators
Source organization:
World Bank national accounts data, and OECD National Accounts data files.
Categories, topics:
Economy & Growth
Last updated:
apr 23, 2017
Indicators value changes by year
Minimum:
66.044
jan 1, 1995
At the date of observation
Value
Absolute change
Change from previous value
jan 1, 1961
83.26
+83.26
0.0%
jan 1, 1962
82.41
-0.85
-1.02%
jan 1, 1963
81.818
-0.592
-0.72%
jan 1, 1964
81.652
-0.166
-0.2%
jan 1, 1965
80.219
-1.434
-1.76%
jan 1, 1966
79.163
-1.056
-1.32%
jan 1, 1967
78.836
-0.327
-0.41%
jan 1, 1968
78.085
-0.75
-0.95%
jan 1, 1969
78.032
-0.053
-0.07%
jan 1, 1970
77.968
-0.064
-0.08%
jan 1, 1971
76.641
-1.327
-1.7%
jan 1, 1972
77.691
+1.05
1.37%
jan 1, 1973
74.957
-2.734
-3.52%
jan 1, 1974
75.357
+0.4
0.53%
jan 1, 1975
77.128
+1.771
2.35%
jan 1, 1976
77.087
-0.041
-0.05%
jan 1, 1977
74.065
-3.022
-3.92%
jan 1, 1978
73.994
-0.07
-0.1%
jan 1, 1979
75.871
+1.877
2.54%
jan 1, 1980
76.412
+0.541
0.71%
jan 1, 1981
77.049
+0.637
0.83%
jan 1, 1982
76.957
-0.091
-0.12%
jan 1, 1983
76.257
-0.701
-0.91%
jan 1, 1984
78.411
+2.155
2.83%
jan 1, 1985
79.551
+1.14
1.45%
jan 1, 1986
79.077
-0.474
-0.6%
jan 1, 1987
76.354
-2.723
-3.44%
jan 1, 1988
68.687
-7.667
-10.04%
jan 1, 1989
66.144
-2.544
-3.7%
jan 1, 1990
68.762
+2.618
3.96%
jan 1, 1991
68.703
-0.059
-0.09%
jan 1, 1992
67.662
-1.04
-1.51%
jan 1, 1993
66.666
-0.997
-1.47%
jan 1, 1994
66.16
-0.506
-0.76%
jan 1, 1995
66.044
-0.116
-0.18%
jan 1, 1996
68.2
+2.156
3.27%
jan 1, 1997
70.162
+1.962
2.88%
jan 1, 1998
68.437
-1.725
-2.46%
jan 1, 1999
66.476
-1.96
-2.86%
jan 1, 2000
68.493
+2.017
3.03%
jan 1, 2001
70.503
+2.01
2.93%
jan 1, 2002
68.394
-2.109
-2.99%
jan 1, 2003
68.021
-0.373
-0.54%
jan 1, 2004
71.247
+3.225
4.74%
jan 1, 2005
71.294
+0.048
0.07%
jan 1, 2006
71.718
+0.424
0.59%
jan 1, 2007
70.524
-1.194
-1.66%
jan 1, 2008
71.306
+0.782
1.11%
jan 1, 2009
69.85
-1.457
-2.04%
jan 1, 2010
71.467
+1.618
2.32%
jan 1, 2011
71.692
+0.225
0.31%
jan 1, 2012
71.19
-0.503
-0.7%
jan 1, 2013
70.186
-1.003
-1.41%
jan 1, 2014
70.805
+0.619
0.88%
jan 1, 2015
68.893
-1.912
-2.7%
jan 1, 2016
69.074
+0.181
0.26%
Ranking of countries by current statistics by years


Comments: