29
/
en
AIzaSyAYiBZKx7MnpbEhh9jyipgxe19OcubqV5w
April 1, 2024
247645
Spain
ESP
true
2
1
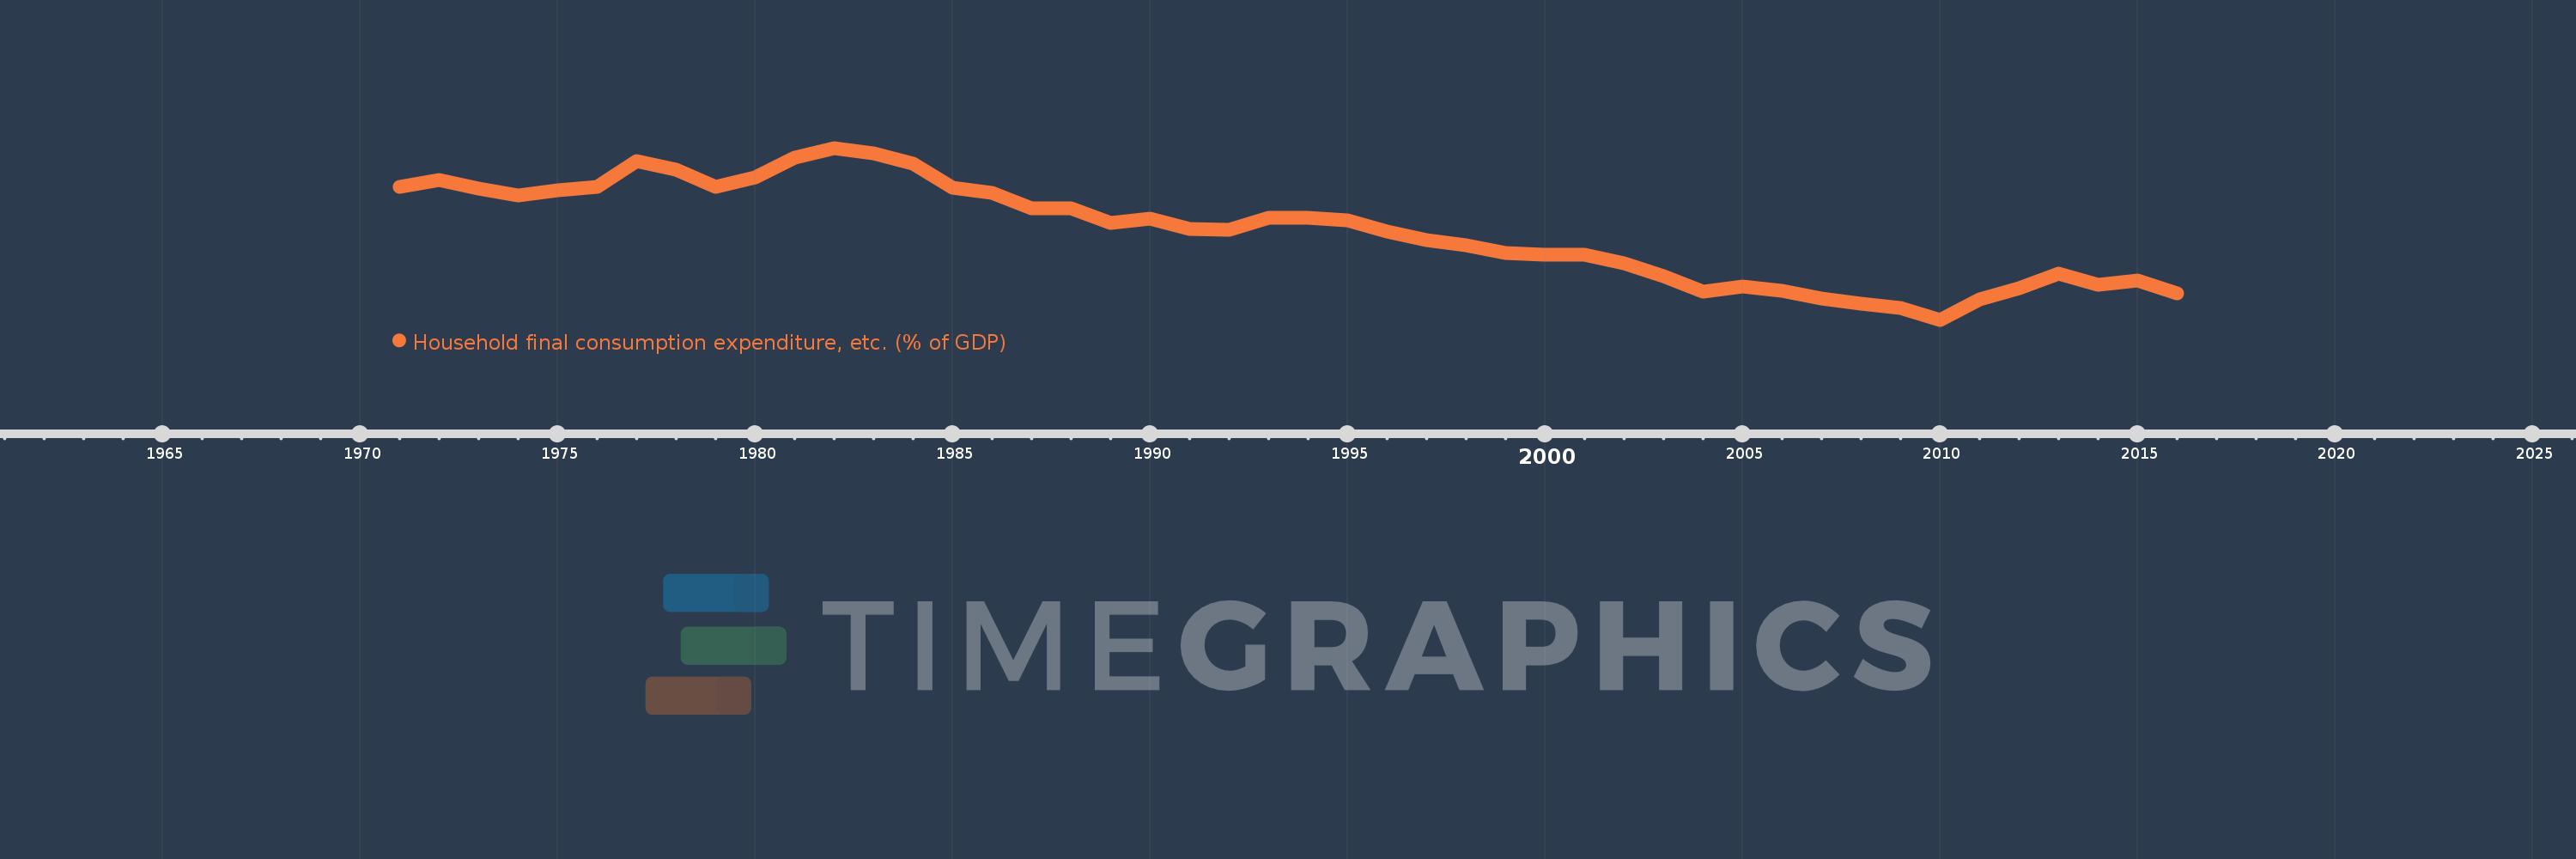
Household final consumption expenditure, etc. (% of GDP)
2016,2015,2014,2013,2012,2011,2010,2009,2008,2007,2006,2005,2004,2003,2002,2001,2000,1999,1998,1997,1996,1995,1994,1993,1992,1991,1990,1989,1988,1987,1986,1985,1984,1983,1982,1981,1980,1979,1978,1977,1976,1975,1974,1973,1972,1971
This statistics in other country:
AfghanistanAlbaniaAlgeriaAngolaAntigua and BarbudaArab WorldArgentinaArmeniaArubaAustraliaAustriaAzerbaijanBahamas, TheBahrainBangladeshBarbadosBelarusBelgiumBelizeBeninBermudaBhutanBoliviaBosnia and HerzegovinaBotswanaBrazilBrunei DarussalamBulgariaBurkina FasoBurundiCabo VerdeCambodiaCameroonCanadaCaribbean small statesCentral African RepublicCentral Europe and the BalticsChadChileChinaColombiaComorosCongo, Dem. Rep.Congo, Rep.Costa RicaCote d'IvoireCroatiaCubaCyprusCzech RepublicDenmarkDjiboutiDominicaDominican RepublicEarly-demographic dividendEast Asia & PacificEast Asia & Pacific (excluding high income)East Asia & Pacific (IDA & IBRD countries)EcuadorEgypt, Arab Rep.El SalvadorEquatorial GuineaEritreaEstoniaEthiopiaEuro areaEurope & Central AsiaEurope & Central Asia (excluding high income)Europe & Central Asia (IDA & IBRD countries)European UnionFaroe IslandsFijiFinlandFragile and conflict affected situationsFranceGabonGambia, TheGeorgiaGermanyGhanaGreeceGrenadaGuatemalaGuineaGuinea-BissauGuyanaHaitiHeavily indebted poor countries (HIPC)High incomeHondurasHong Kong SAR, ChinaHungaryIBRD onlyIcelandIDA & IBRD totalIDA blendIDA onlyIDA totalIndiaIndonesiaIran, Islamic Rep.IraqIrelandIsraelItalyJamaicaJapanJordanKazakhstanKenyaKiribatiKorea, Rep.KosovoKuwaitKyrgyz RepublicLao PDRLate-demographic dividendLatin America & Caribbean Latin America & Caribbean (excluding high income)Latin America & the Caribbean (IDA & IBRD countries)LatviaLeast developed countries: UN classificationLebanonLesothoLiberiaLibyaLithuaniaLow & middle incomeLow incomeLower middle incomeLuxembourgMacao SAR, ChinaMacedonia, FYRMadagascarMalawiMalaysiaMaldivesMaliMaltaMauritaniaMauritiusMexicoMicronesia, Fed. Sts.Middle East & North AfricaMiddle East & North Africa (excluding high income)Middle East & North Africa (IDA & IBRD countries)Middle incomeMoldovaMongoliaMontenegroMoroccoMozambiqueNamibiaNepalNetherlandsNew CaledoniaNew ZealandNicaraguaNigerNigeriaNorth AmericaNorwayOECD membersOmanOther small statesPacific island small statesPakistanPanamaPapua New GuineaParaguayPeruPhilippinesPolandPortugalPost-demographic dividendPre-demographic dividendPuerto RicoQatarRomaniaRussian FederationRwandaSaudi ArabiaSenegalSerbiaSeychellesSierra LeoneSingaporeSlovak RepublicSloveniaSmall statesSolomon IslandsSomaliaSouth AfricaSouth AsiaSouth Asia (IDA & IBRD)South SudanSpainSri LankaSt. Kitts and NevisSt. LuciaSt. Vincent and the GrenadinesSub-Saharan Africa Sub-Saharan Africa (excluding high income)Sub-Saharan Africa (IDA & IBRD countries)SudanSurinameSwazilandSwedenSwitzerlandSyrian Arab RepublicTajikistanTanzaniaThailandTimor-LesteTogoTongaTrinidad and TobagoTunisiaTurkeyTurkmenistanUgandaUkraineUnited Arab EmiratesUnited KingdomUnited StatesUpper middle incomeUruguayUzbekistanVanuatuVenezuela, RBVietnamWest Bank and GazaWorldYemen, Rep.ZambiaZimbabwe Timeline:
This timeline shows a graph from 1971 to 2016 of Spain. No data until 1970. Number of actual observations by date: 46.
Source name:
World Development Indicators
Source organization:
World Bank national accounts data, and OECD National Accounts data files.
Categories, topics:
Economy & Growth
Last updated:
apr 23, 2017
Indicators value changes by year
Minimum:
56.101
jan 1, 2010
Maximum:
65.565
jan 1, 1982
At the date of observation
Value
Absolute change
Change from previous value
jan 1, 1971
63.411
+63.411
0.0%
jan 1, 1972
63.815
+0.404
0.64%
jan 1, 1973
63.331
-0.484
-0.76%
jan 1, 1974
62.928
-0.404
-0.64%
jan 1, 1975
63.248
+0.32
0.51%
jan 1, 1976
63.409
+0.161
0.26%
jan 1, 1977
64.818
+1.409
2.22%
jan 1, 1978
64.359
-0.459
-0.71%
jan 1, 1979
63.404
-0.955
-1.48%
jan 1, 1980
63.945
+0.541
0.85%
jan 1, 1981
65.028
+1.084
1.69%
jan 1, 1982
65.565
+0.537
0.83%
jan 1, 1983
65.27
-0.295
-0.45%
jan 1, 1984
64.71
-0.56
-0.86%
jan 1, 1985
63.38
-1.329
-2.05%
jan 1, 1986
63.094
-0.287
-0.45%
jan 1, 1987
62.221
-0.873
-1.38%
jan 1, 1988
62.218
-0.003
-0.01%
jan 1, 1989
61.435
-0.783
-1.26%
jan 1, 1990
61.687
+0.252
0.41%
jan 1, 1991
61.101
-0.586
-0.95%
jan 1, 1992
61.037
-0.064
-0.1%
jan 1, 1993
61.732
+0.695
1.14%
jan 1, 1994
61.7
-0.032
-0.05%
jan 1, 1995
61.571
-0.129
-0.21%
jan 1, 1996
60.946
-0.625
-1.02%
jan 1, 1997
60.466
-0.479
-0.79%
jan 1, 1998
60.227
-0.24
-0.4%
jan 1, 1999
59.769
-0.457
-0.76%
jan 1, 2000
59.679
-0.09
-0.15%
jan 1, 2001
59.697
+0.018
0.03%
jan 1, 2002
59.208
-0.489
-0.82%
jan 1, 2003
58.504
-0.704
-1.19%
jan 1, 2004
57.63
-0.874
-1.49%
jan 1, 2005
57.942
+0.312
0.54%
jan 1, 2006
57.673
-0.269
-0.46%
jan 1, 2007
57.265
-0.408
-0.71%
jan 1, 2008
56.98
-0.285
-0.5%
jan 1, 2009
56.758
-0.221
-0.39%
jan 1, 2010
56.101
-0.658
-1.16%
jan 1, 2011
57.244
+1.143
2.04%
jan 1, 2012
57.816
+0.572
1.0%
jan 1, 2013
58.625
+0.809
1.4%
jan 1, 2014
58.026
-0.598
-1.02%
jan 1, 2015
58.284
+0.258
0.44%
jan 1, 2016
57.552
-0.732
-1.26%
Ranking of countries by current statistics by years


Comments: