29
/
en
AIzaSyAYiBZKx7MnpbEhh9jyipgxe19OcubqV5w
April 1, 2024
195652
Mexico
MEX
true
2
1
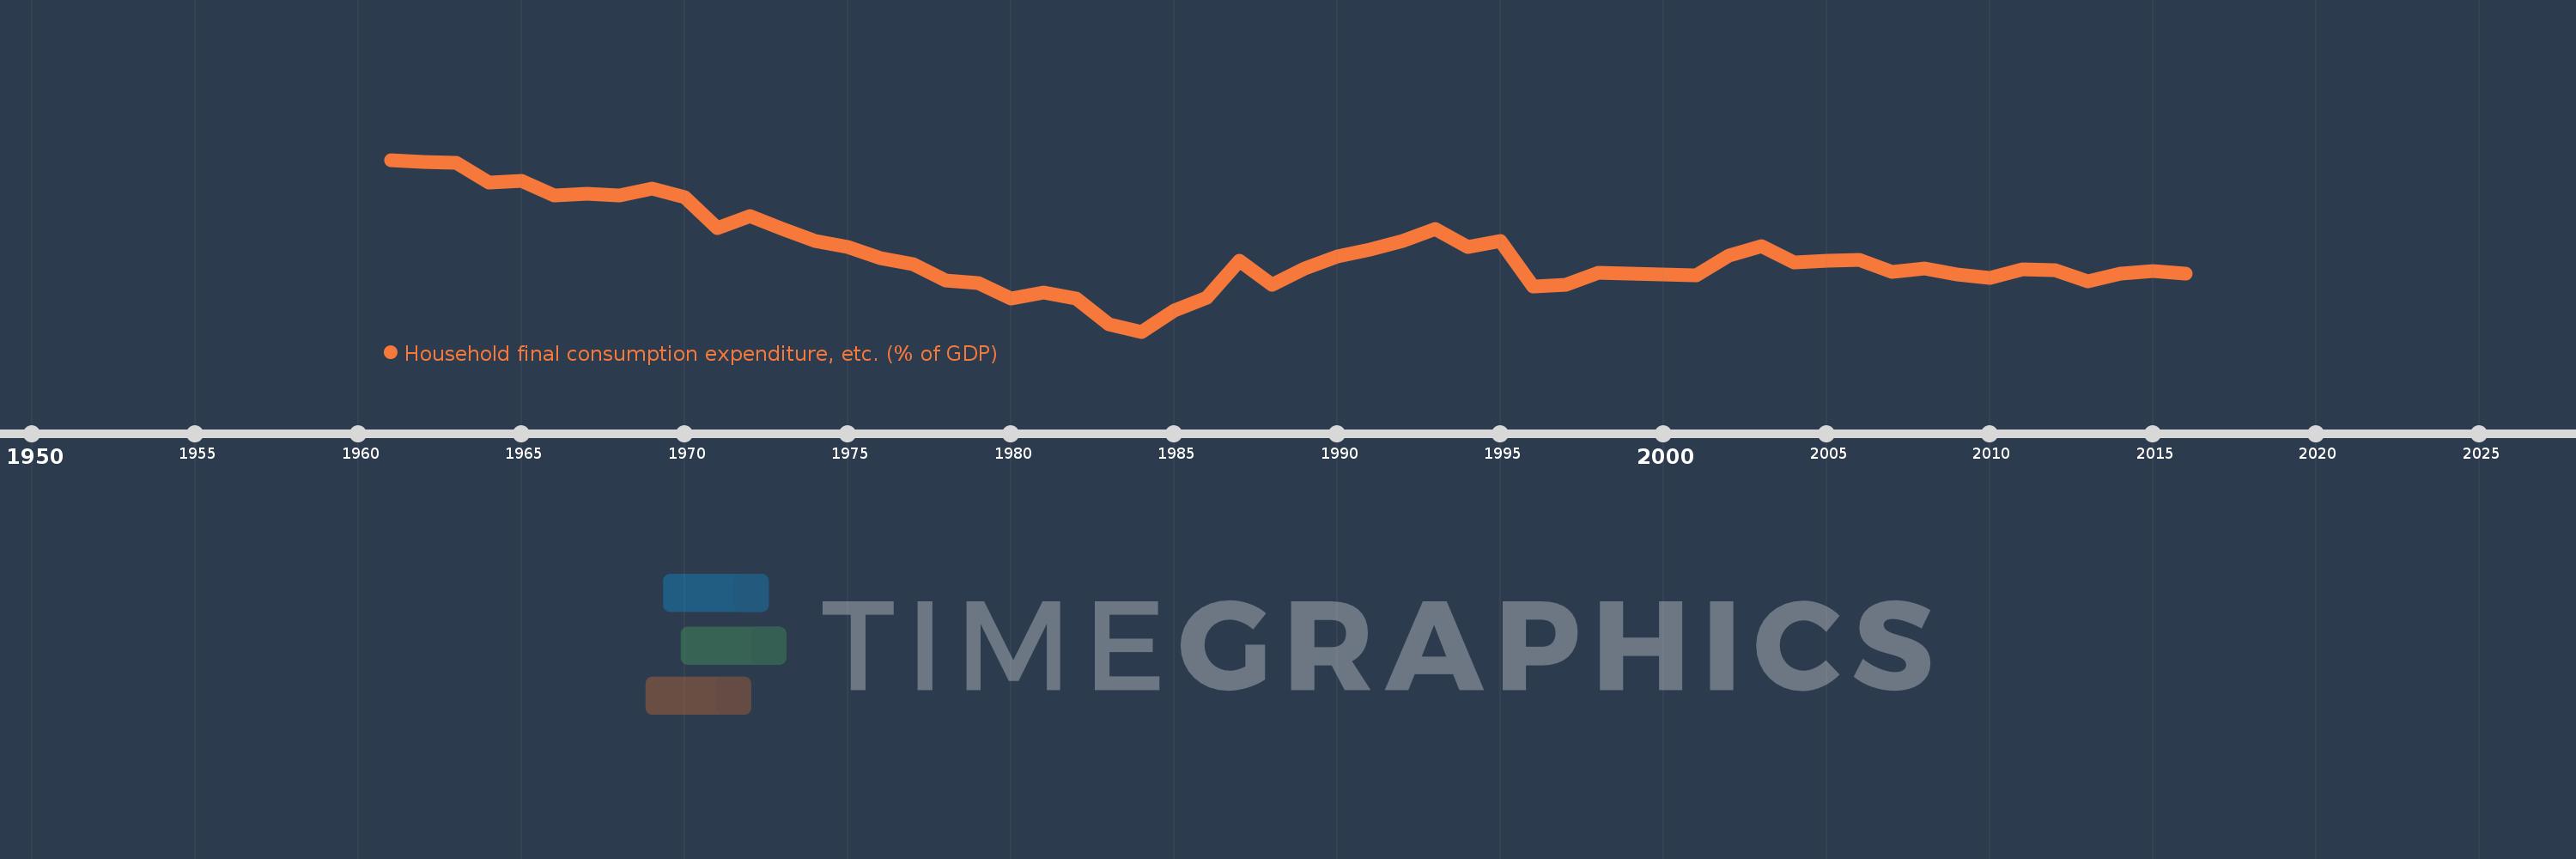
Household final consumption expenditure, etc. (% of GDP)
2016,2015,2014,2013,2012,2011,2010,2009,2008,2007,2006,2005,2004,2003,2002,2001,2000,1999,1998,1997,1996,1995,1994,1993,1992,1991,1990,1989,1988,1987,1986,1985,1984,1983,1982,1981,1980,1979,1978,1977,1976,1975,1974,1973,1972,1971,1970,1969,1968,1967,1966,1965,1964,1963,1962,1961
This statistics in other country:
AfghanistanAlbaniaAlgeriaAngolaAntigua and BarbudaArab WorldArgentinaArmeniaArubaAustraliaAustriaAzerbaijanBahamas, TheBahrainBangladeshBarbadosBelarusBelgiumBelizeBeninBermudaBhutanBoliviaBosnia and HerzegovinaBotswanaBrazilBrunei DarussalamBulgariaBurkina FasoBurundiCabo VerdeCambodiaCameroonCanadaCaribbean small statesCentral African RepublicCentral Europe and the BalticsChadChileChinaColombiaComorosCongo, Dem. Rep.Congo, Rep.Costa RicaCote d'IvoireCroatiaCubaCyprusCzech RepublicDenmarkDjiboutiDominicaDominican RepublicEarly-demographic dividendEast Asia & PacificEast Asia & Pacific (excluding high income)East Asia & Pacific (IDA & IBRD countries)EcuadorEgypt, Arab Rep.El SalvadorEquatorial GuineaEritreaEstoniaEthiopiaEuro areaEurope & Central AsiaEurope & Central Asia (excluding high income)Europe & Central Asia (IDA & IBRD countries)European UnionFaroe IslandsFijiFinlandFragile and conflict affected situationsFranceGabonGambia, TheGeorgiaGermanyGhanaGreeceGrenadaGuatemalaGuineaGuinea-BissauGuyanaHaitiHeavily indebted poor countries (HIPC)High incomeHondurasHong Kong SAR, ChinaHungaryIBRD onlyIcelandIDA & IBRD totalIDA blendIDA onlyIDA totalIndiaIndonesiaIran, Islamic Rep.IraqIrelandIsraelItalyJamaicaJapanJordanKazakhstanKenyaKiribatiKorea, Rep.KosovoKuwaitKyrgyz RepublicLao PDRLate-demographic dividendLatin America & Caribbean Latin America & Caribbean (excluding high income)Latin America & the Caribbean (IDA & IBRD countries)LatviaLeast developed countries: UN classificationLebanonLesothoLiberiaLibyaLithuaniaLow & middle incomeLow incomeLower middle incomeLuxembourgMacao SAR, ChinaMacedonia, FYRMadagascarMalawiMalaysiaMaldivesMaliMaltaMauritaniaMauritiusMexicoMicronesia, Fed. Sts.Middle East & North AfricaMiddle East & North Africa (excluding high income)Middle East & North Africa (IDA & IBRD countries)Middle incomeMoldovaMongoliaMontenegroMoroccoMozambiqueNamibiaNepalNetherlandsNew CaledoniaNew ZealandNicaraguaNigerNigeriaNorth AmericaNorwayOECD membersOmanOther small statesPacific island small statesPakistanPanamaPapua New GuineaParaguayPeruPhilippinesPolandPortugalPost-demographic dividendPre-demographic dividendPuerto RicoQatarRomaniaRussian FederationRwandaSaudi ArabiaSenegalSerbiaSeychellesSierra LeoneSingaporeSlovak RepublicSloveniaSmall statesSolomon IslandsSomaliaSouth AfricaSouth AsiaSouth Asia (IDA & IBRD)South SudanSpainSri LankaSt. Kitts and NevisSt. LuciaSt. Vincent and the GrenadinesSub-Saharan Africa Sub-Saharan Africa (excluding high income)Sub-Saharan Africa (IDA & IBRD countries)SudanSurinameSwazilandSwedenSwitzerlandSyrian Arab RepublicTajikistanTanzaniaThailandTimor-LesteTogoTongaTrinidad and TobagoTunisiaTurkeyTurkmenistanUgandaUkraineUnited Arab EmiratesUnited KingdomUnited StatesUpper middle incomeUruguayUzbekistanVanuatuVenezuela, RBVietnamWest Bank and GazaWorldYemen, Rep.ZambiaZimbabwe Timeline:
This timeline shows a graph from 1961 to 2016 of Mexico. No data until 1960. Number of actual observations by date: 56.
Source name:
World Development Indicators
Source organization:
World Bank national accounts data, and OECD National Accounts data files.
Categories, topics:
Economy & Growth
Last updated:
apr 23, 2017
Indicators value changes by year
Minimum:
60.866
jan 1, 1984
Maximum:
79.167
jan 1, 1961
At the date of observation
Value
Absolute change
Change from previous value
jan 1, 1961
79.167
+79.167
0.0%
jan 1, 1962
78.915
-0.252
-0.32%
jan 1, 1963
78.844
-0.071
-0.09%
jan 1, 1964
76.717
-2.127
-2.7%
jan 1, 1965
76.946
+0.229
0.3%
jan 1, 1966
75.331
-1.616
-2.1%
jan 1, 1967
75.598
+0.268
0.36%
jan 1, 1968
75.412
-0.186
-0.25%
jan 1, 1969
76.088
+0.676
0.9%
jan 1, 1970
75.21
-0.878
-1.15%
jan 1, 1971
71.919
-3.291
-4.38%
jan 1, 1972
73.219
+1.3
1.81%
jan 1, 1973
71.816
-1.403
-1.92%
jan 1, 1974
70.487
-1.329
-1.85%
jan 1, 1975
69.841
-0.646
-0.92%
jan 1, 1976
68.717
-1.124
-1.61%
jan 1, 1977
68.08
-0.637
-0.93%
jan 1, 1978
66.301
-1.779
-2.61%
jan 1, 1979
66.049
-0.252
-0.38%
jan 1, 1980
64.413
-1.637
-2.48%
jan 1, 1981
65.073
+0.66
1.02%
jan 1, 1982
64.376
-0.697
-1.07%
jan 1, 1983
61.603
-2.773
-4.31%
jan 1, 1984
60.866
-0.737
-1.2%
jan 1, 1985
63.076
+2.21
3.63%
jan 1, 1986
64.514
+1.438
2.28%
jan 1, 1987
68.453
+3.939
6.11%
jan 1, 1988
65.835
-2.618
-3.82%
jan 1, 1989
67.635
+1.8
2.73%
jan 1, 1990
68.853
+1.218
1.8%
jan 1, 1991
69.579
+0.726
1.05%
jan 1, 1992
70.501
+0.922
1.33%
jan 1, 1993
71.812
+1.311
1.86%
jan 1, 1994
69.834
-1.978
-2.75%
jan 1, 1995
70.524
+0.69
0.99%
jan 1, 1996
65.668
-4.856
-6.89%
jan 1, 1997
65.85
+0.182
0.28%
jan 1, 1998
67.175
+1.325
2.01%
jan 1, 1999
67.032
-0.143
-0.21%
jan 1, 2000
66.978
-0.054
-0.08%
jan 1, 2001
66.822
-0.156
-0.23%
jan 1, 2002
68.926
+2.104
3.15%
jan 1, 2003
70.0
+1.073
1.56%
jan 1, 2004
68.244
-1.755
-2.51%
jan 1, 2005
68.426
+0.181
0.27%
jan 1, 2006
68.476
+0.05
0.07%
jan 1, 2007
67.229
-1.247
-1.82%
jan 1, 2008
67.627
+0.398
0.59%
jan 1, 2009
66.956
-0.671
-0.99%
jan 1, 2010
66.581
-0.375
-0.56%
jan 1, 2011
67.489
+0.908
1.36%
jan 1, 2012
67.415
-0.074
-0.11%
jan 1, 2013
66.235
-1.18
-1.75%
jan 1, 2014
67.036
+0.801
1.21%
jan 1, 2015
67.303
+0.267
0.4%
jan 1, 2016
67.08
-0.223
-0.33%
Ranking of countries by current statistics by years


Comments: