29
/
en
AIzaSyAYiBZKx7MnpbEhh9jyipgxe19OcubqV5w
April 1, 2024
101185
Canada
CAN
true
2
1
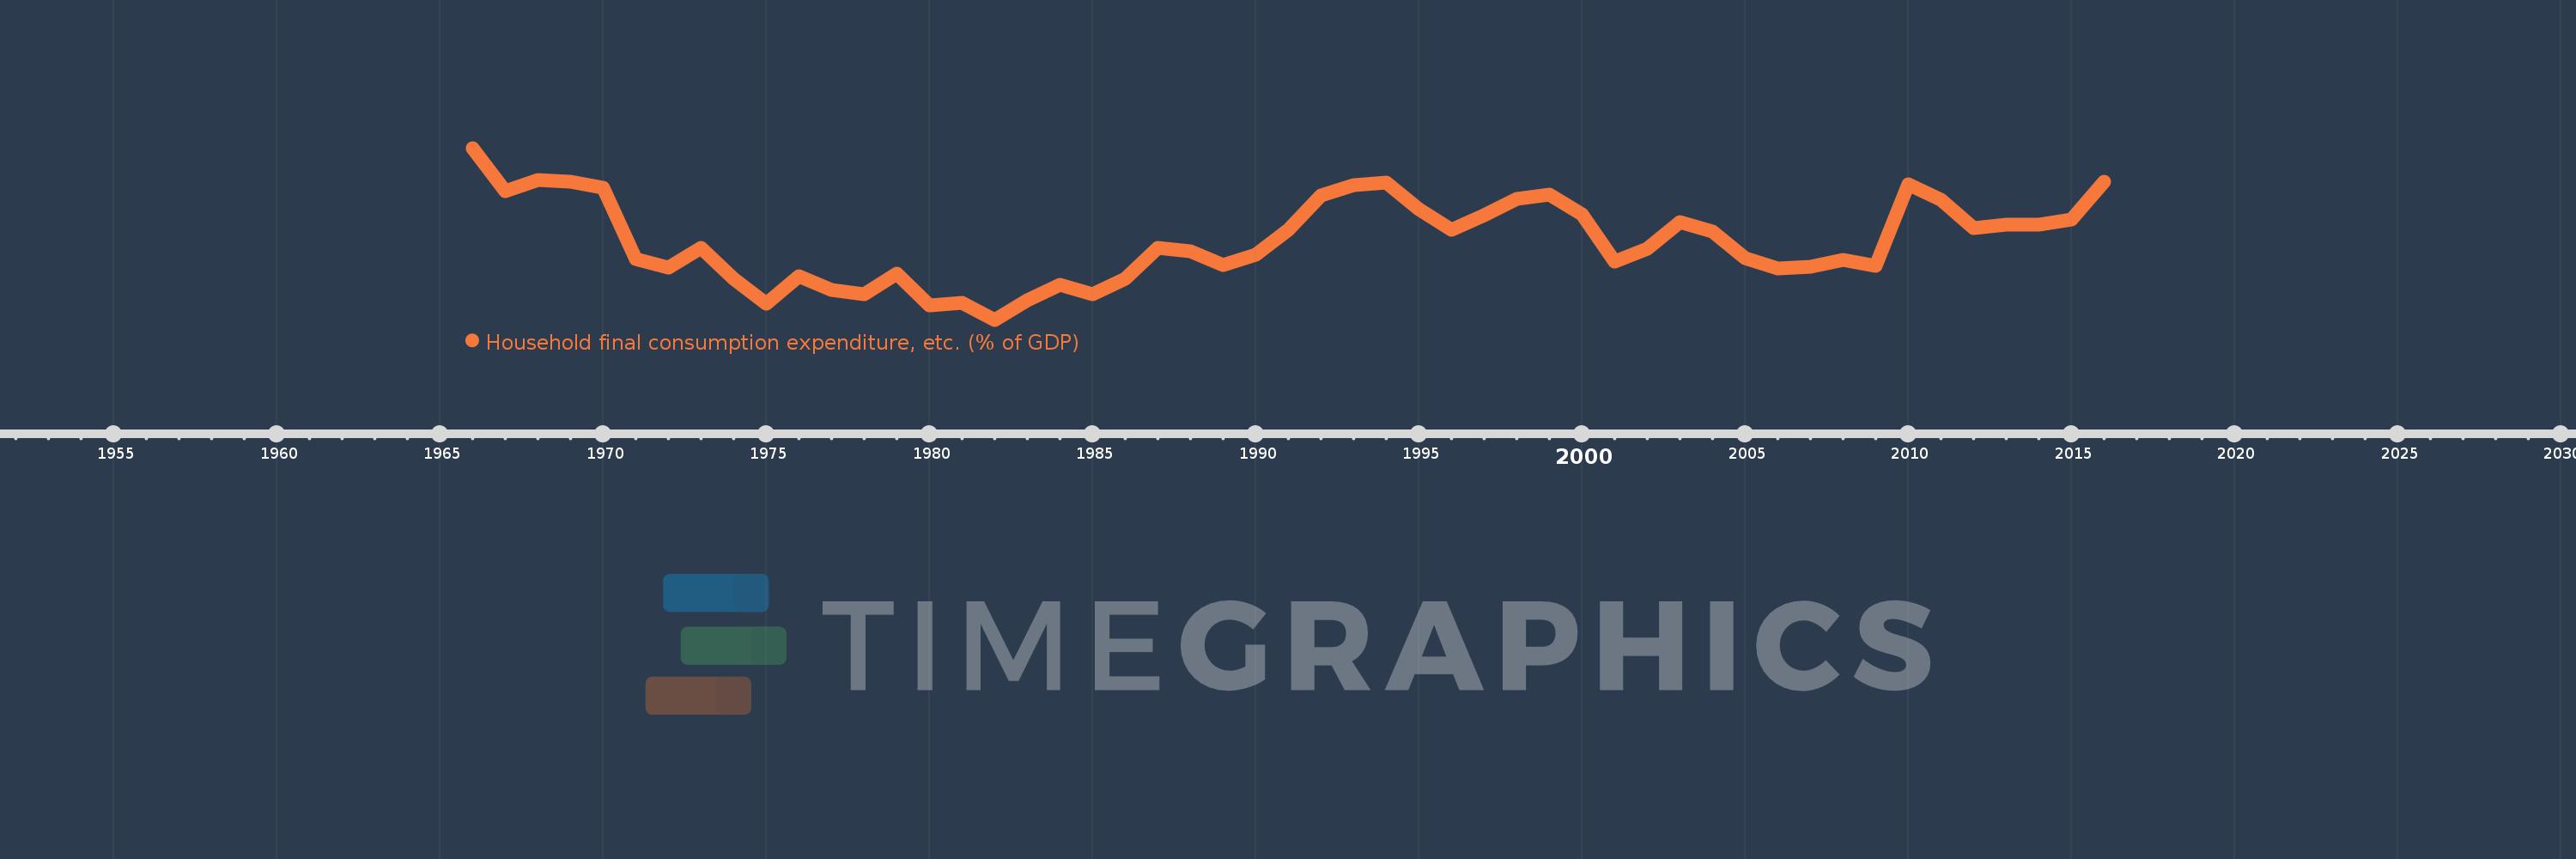
Household final consumption expenditure, etc. (% of GDP)
2016,2015,2014,2013,2012,2011,2010,2009,2008,2007,2006,2005,2004,2003,2002,2001,2000,1999,1998,1997,1996,1995,1994,1993,1992,1991,1990,1989,1988,1987,1986,1985,1984,1983,1982,1981,1980,1979,1978,1977,1976,1975,1974,1973,1972,1971,1970,1969,1968,1967,1966
This statistics in other country:
AfghanistanAlbaniaAlgeriaAngolaAntigua and BarbudaArab WorldArgentinaArmeniaArubaAustraliaAustriaAzerbaijanBahamas, TheBahrainBangladeshBarbadosBelarusBelgiumBelizeBeninBermudaBhutanBoliviaBosnia and HerzegovinaBotswanaBrazilBrunei DarussalamBulgariaBurkina FasoBurundiCabo VerdeCambodiaCameroonCanadaCaribbean small statesCentral African RepublicCentral Europe and the BalticsChadChileChinaColombiaComorosCongo, Dem. Rep.Congo, Rep.Costa RicaCote d'IvoireCroatiaCubaCyprusCzech RepublicDenmarkDjiboutiDominicaDominican RepublicEarly-demographic dividendEast Asia & PacificEast Asia & Pacific (excluding high income)East Asia & Pacific (IDA & IBRD countries)EcuadorEgypt, Arab Rep.El SalvadorEquatorial GuineaEritreaEstoniaEthiopiaEuro areaEurope & Central AsiaEurope & Central Asia (excluding high income)Europe & Central Asia (IDA & IBRD countries)European UnionFaroe IslandsFijiFinlandFragile and conflict affected situationsFranceGabonGambia, TheGeorgiaGermanyGhanaGreeceGrenadaGuatemalaGuineaGuinea-BissauGuyanaHaitiHeavily indebted poor countries (HIPC)High incomeHondurasHong Kong SAR, ChinaHungaryIBRD onlyIcelandIDA & IBRD totalIDA blendIDA onlyIDA totalIndiaIndonesiaIran, Islamic Rep.IraqIrelandIsraelItalyJamaicaJapanJordanKazakhstanKenyaKiribatiKorea, Rep.KosovoKuwaitKyrgyz RepublicLao PDRLate-demographic dividendLatin America & Caribbean Latin America & Caribbean (excluding high income)Latin America & the Caribbean (IDA & IBRD countries)LatviaLeast developed countries: UN classificationLebanonLesothoLiberiaLibyaLithuaniaLow & middle incomeLow incomeLower middle incomeLuxembourgMacao SAR, ChinaMacedonia, FYRMadagascarMalawiMalaysiaMaldivesMaliMaltaMauritaniaMauritiusMexicoMicronesia, Fed. Sts.Middle East & North AfricaMiddle East & North Africa (excluding high income)Middle East & North Africa (IDA & IBRD countries)Middle incomeMoldovaMongoliaMontenegroMoroccoMozambiqueNamibiaNepalNetherlandsNew CaledoniaNew ZealandNicaraguaNigerNigeriaNorth AmericaNorwayOECD membersOmanOther small statesPacific island small statesPakistanPanamaPapua New GuineaParaguayPeruPhilippinesPolandPortugalPost-demographic dividendPre-demographic dividendPuerto RicoQatarRomaniaRussian FederationRwandaSaudi ArabiaSenegalSerbiaSeychellesSierra LeoneSingaporeSlovak RepublicSloveniaSmall statesSolomon IslandsSomaliaSouth AfricaSouth AsiaSouth Asia (IDA & IBRD)South SudanSpainSri LankaSt. Kitts and NevisSt. LuciaSt. Vincent and the GrenadinesSub-Saharan Africa Sub-Saharan Africa (excluding high income)Sub-Saharan Africa (IDA & IBRD countries)SudanSurinameSwazilandSwedenSwitzerlandSyrian Arab RepublicTajikistanTanzaniaThailandTimor-LesteTogoTongaTrinidad and TobagoTunisiaTurkeyTurkmenistanUgandaUkraineUnited Arab EmiratesUnited KingdomUnited StatesUpper middle incomeUruguayUzbekistanVanuatuVenezuela, RBVietnamWest Bank and GazaWorldYemen, Rep.ZambiaZimbabwe Timeline:
This timeline shows a graph from 1966 to 2016 of Canada. No data until 1965. Number of actual observations by date: 51.
Source name:
World Development Indicators
Source organization:
World Bank national accounts data, and OECD National Accounts data files.
Categories, topics:
Economy & Growth
Last updated:
apr 23, 2017
Indicators value changes by year
Minimum:
52.374
jan 1, 1982
Maximum:
58.785
jan 1, 1966
At the date of observation
Value
Absolute change
Change from previous value
jan 1, 1966
58.785
+58.785
0.0%
jan 1, 1967
57.16
-1.625
-2.76%
jan 1, 1968
57.587
+0.427
0.75%
jan 1, 1969
57.532
-0.055
-0.1%
jan 1, 1970
57.297
-0.234
-0.41%
jan 1, 1971
54.625
-2.672
-4.66%
jan 1, 1972
54.319
-0.306
-0.56%
jan 1, 1973
55.062
+0.743
1.37%
jan 1, 1974
53.894
-1.168
-2.12%
jan 1, 1975
52.966
-0.928
-1.72%
jan 1, 1976
54.015
+1.049
1.98%
jan 1, 1977
53.48
-0.534
-0.99%
jan 1, 1978
53.314
-0.166
-0.31%
jan 1, 1979
54.098
+0.784
1.47%
jan 1, 1980
52.897
-1.201
-2.22%
jan 1, 1981
53.004
+0.107
0.2%
jan 1, 1982
52.374
-0.631
-1.19%
jan 1, 1983
53.086
+0.712
1.36%
jan 1, 1984
53.691
+0.605
1.14%
jan 1, 1985
53.339
-0.351
-0.65%
jan 1, 1986
53.916
+0.576
1.08%
jan 1, 1987
55.068
+1.152
2.14%
jan 1, 1988
54.93
-0.138
-0.25%
jan 1, 1989
54.405
-0.525
-0.96%
jan 1, 1990
54.79
+0.384
0.71%
jan 1, 1991
55.742
+0.952
1.74%
jan 1, 1992
57.013
+1.272
2.28%
jan 1, 1993
57.391
+0.378
0.66%
jan 1, 1994
57.481
+0.09
0.16%
jan 1, 1995
56.514
-0.967
-1.68%
jan 1, 1996
55.717
-0.797
-1.41%
jan 1, 1997
56.263
+0.545
0.98%
jan 1, 1998
56.891
+0.629
1.12%
jan 1, 1999
57.046
+0.155
0.27%
jan 1, 2000
56.297
-0.749
-1.31%
jan 1, 2001
54.529
-1.768
-3.14%
jan 1, 2002
55.015
+0.486
0.89%
jan 1, 2003
56.005
+0.99
1.8%
jan 1, 2004
55.682
-0.323
-0.58%
jan 1, 2005
54.665
-1.017
-1.83%
jan 1, 2006
54.278
-0.387
-0.71%
jan 1, 2007
54.352
+0.075
0.14%
jan 1, 2008
54.614
+0.262
0.48%
jan 1, 2009
54.377
-0.237
-0.43%
jan 1, 2010
57.441
+3.064
5.64%
jan 1, 2011
56.853
-0.588
-1.02%
jan 1, 2012
55.796
-1.057
-1.86%
jan 1, 2013
55.934
+0.138
0.25%
jan 1, 2014
55.91
-0.024
-0.04%
jan 1, 2015
56.111
+0.201
0.36%
jan 1, 2016
57.511
+1.4
2.49%
Ranking of countries by current statistics by years


Comments: