29
/
en
AIzaSyAYiBZKx7MnpbEhh9jyipgxe19OcubqV5w
April 1, 2024
218440
Panama
PAN
true
2
1
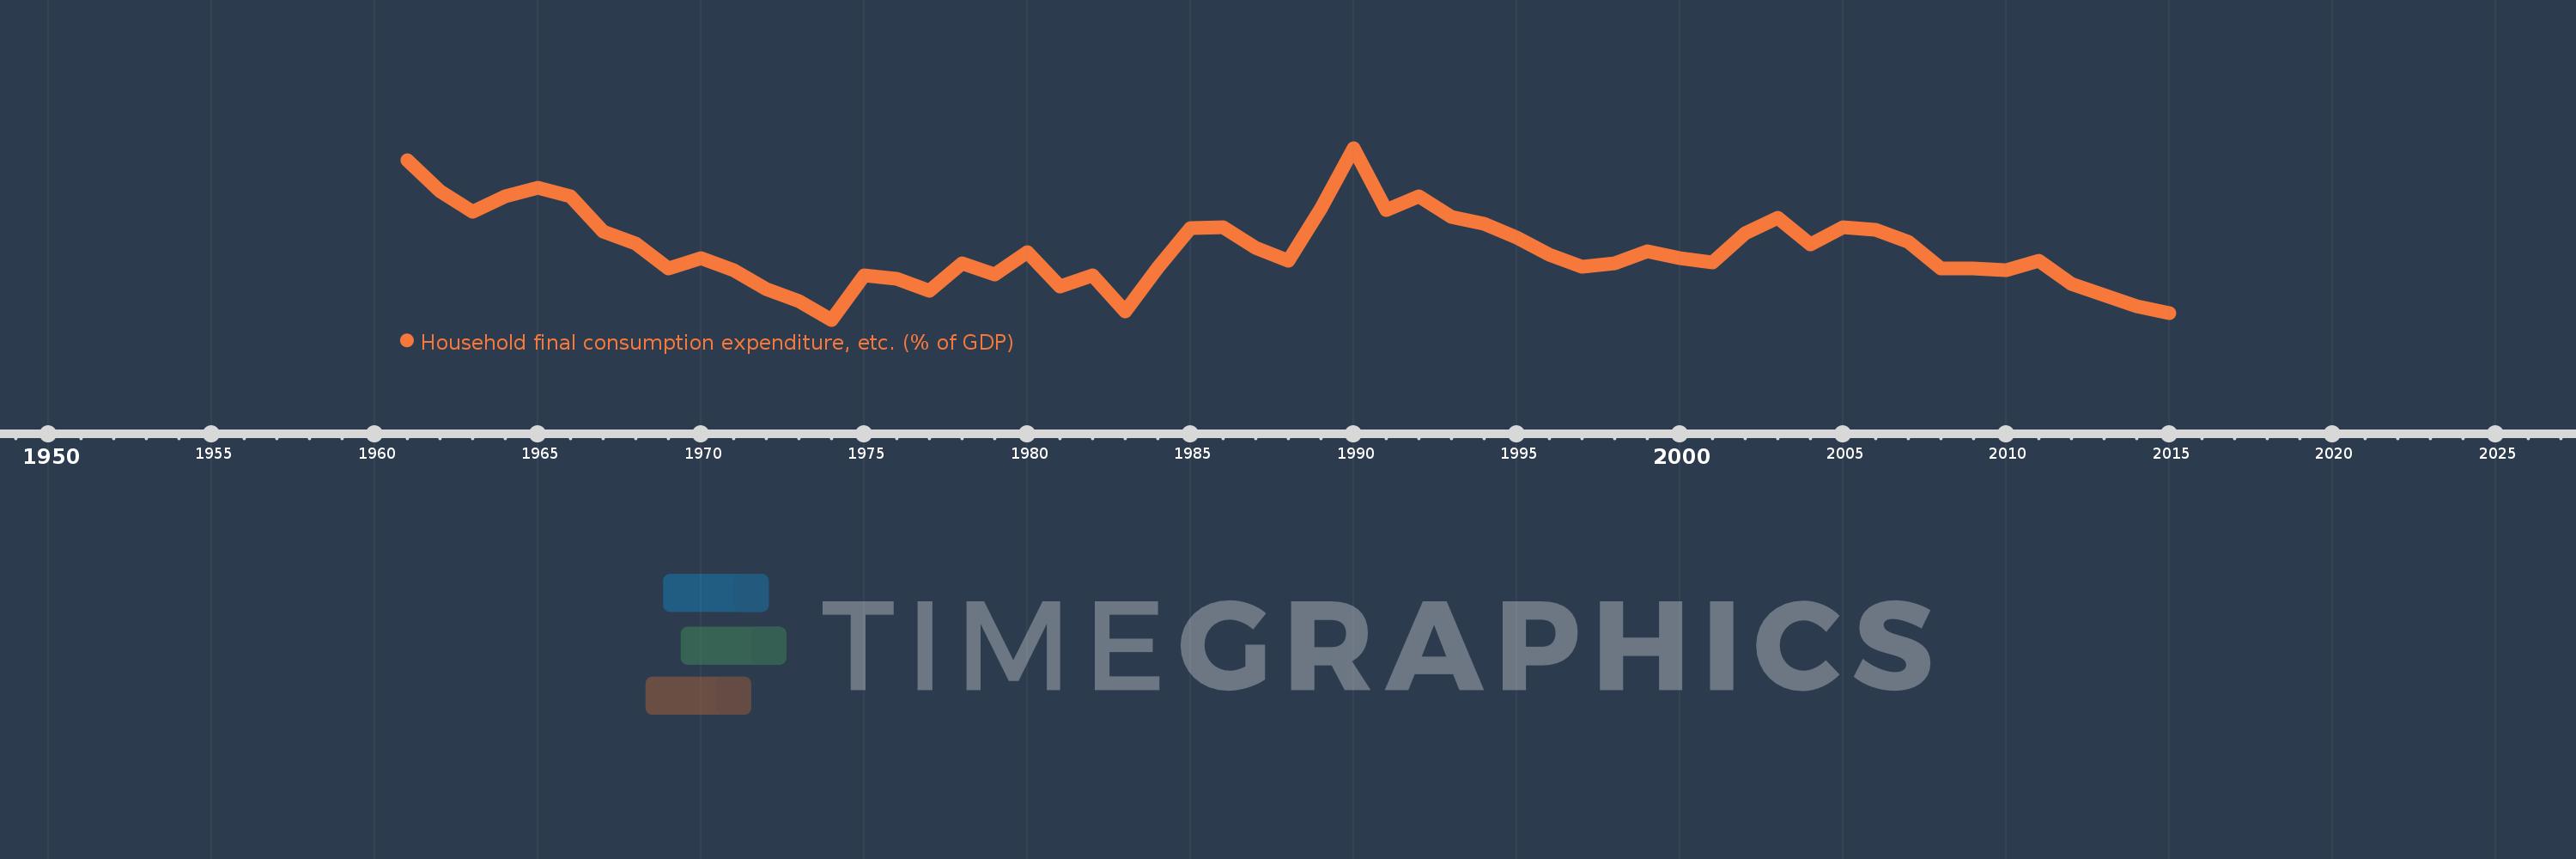
Household final consumption expenditure, etc. (% of GDP)
2015,2014,2013,2012,2011,2010,2009,2008,2007,2006,2005,2004,2003,2002,2001,2000,1999,1998,1997,1996,1995,1994,1993,1992,1991,1990,1989,1988,1987,1986,1985,1984,1983,1982,1981,1980,1979,1978,1977,1976,1975,1974,1973,1972,1971,1970,1969,1968,1967,1966,1965,1964,1963,1962,1961
This statistics in other country:
AfghanistanAlbaniaAlgeriaAngolaAntigua and BarbudaArab WorldArgentinaArmeniaArubaAustraliaAustriaAzerbaijanBahamas, TheBahrainBangladeshBarbadosBelarusBelgiumBelizeBeninBermudaBhutanBoliviaBosnia and HerzegovinaBotswanaBrazilBrunei DarussalamBulgariaBurkina FasoBurundiCabo VerdeCambodiaCameroonCanadaCaribbean small statesCentral African RepublicCentral Europe and the BalticsChadChileChinaColombiaComorosCongo, Dem. Rep.Congo, Rep.Costa RicaCote d'IvoireCroatiaCubaCyprusCzech RepublicDenmarkDjiboutiDominicaDominican RepublicEarly-demographic dividendEast Asia & PacificEast Asia & Pacific (excluding high income)East Asia & Pacific (IDA & IBRD countries)EcuadorEgypt, Arab Rep.El SalvadorEquatorial GuineaEritreaEstoniaEthiopiaEuro areaEurope & Central AsiaEurope & Central Asia (excluding high income)Europe & Central Asia (IDA & IBRD countries)European UnionFaroe IslandsFijiFinlandFragile and conflict affected situationsFranceGabonGambia, TheGeorgiaGermanyGhanaGreeceGrenadaGuatemalaGuineaGuinea-BissauGuyanaHaitiHeavily indebted poor countries (HIPC)High incomeHondurasHong Kong SAR, ChinaHungaryIBRD onlyIcelandIDA & IBRD totalIDA blendIDA onlyIDA totalIndiaIndonesiaIran, Islamic Rep.IraqIrelandIsraelItalyJamaicaJapanJordanKazakhstanKenyaKiribatiKorea, Rep.KosovoKuwaitKyrgyz RepublicLao PDRLate-demographic dividendLatin America & Caribbean Latin America & Caribbean (excluding high income)Latin America & the Caribbean (IDA & IBRD countries)LatviaLeast developed countries: UN classificationLebanonLesothoLiberiaLibyaLithuaniaLow & middle incomeLow incomeLower middle incomeLuxembourgMacao SAR, ChinaMacedonia, FYRMadagascarMalawiMalaysiaMaldivesMaliMaltaMauritaniaMauritiusMexicoMicronesia, Fed. Sts.Middle East & North AfricaMiddle East & North Africa (excluding high income)Middle East & North Africa (IDA & IBRD countries)Middle incomeMoldovaMongoliaMontenegroMoroccoMozambiqueNamibiaNepalNetherlandsNew CaledoniaNew ZealandNicaraguaNigerNigeriaNorth AmericaNorwayOECD membersOmanOther small statesPacific island small statesPakistanPanamaPapua New GuineaParaguayPeruPhilippinesPolandPortugalPost-demographic dividendPre-demographic dividendPuerto RicoQatarRomaniaRussian FederationRwandaSaudi ArabiaSenegalSerbiaSeychellesSierra LeoneSingaporeSlovak RepublicSloveniaSmall statesSolomon IslandsSomaliaSouth AfricaSouth AsiaSouth Asia (IDA & IBRD)South SudanSpainSri LankaSt. Kitts and NevisSt. LuciaSt. Vincent and the GrenadinesSub-Saharan Africa Sub-Saharan Africa (excluding high income)Sub-Saharan Africa (IDA & IBRD countries)SudanSurinameSwazilandSwedenSwitzerlandSyrian Arab RepublicTajikistanTanzaniaThailandTimor-LesteTogoTongaTrinidad and TobagoTunisiaTurkeyTurkmenistanUgandaUkraineUnited Arab EmiratesUnited KingdomUnited StatesUpper middle incomeUruguayUzbekistanVanuatuVenezuela, RBVietnamWest Bank and GazaWorldYemen, Rep.ZambiaZimbabwe Timeline:
This timeline shows a graph from 1961 to 2015 of Panama. No data until 1960. Number of actual observations by date: 55.
Source name:
World Development Indicators
Source organization:
World Bank national accounts data, and OECD National Accounts data files.
Categories, topics:
Economy & Growth
Last updated:
apr 23, 2017
Indicators value changes by year
Minimum:
49.726
jan 1, 1974
Maximum:
78.929
jan 1, 1990
At the date of observation
Value
Absolute change
Change from previous value
jan 1, 1961
76.836
+76.836
0.0%
jan 1, 1962
71.621
-5.216
-6.79%
jan 1, 1963
68.129
-3.492
-4.88%
jan 1, 1964
70.678
+2.549
3.74%
jan 1, 1965
72.174
+1.496
2.12%
jan 1, 1966
70.702
-1.472
-2.04%
jan 1, 1967
64.794
-5.908
-8.36%
jan 1, 1968
62.667
-2.127
-3.28%
jan 1, 1969
58.485
-4.182
-6.67%
jan 1, 1970
60.162
+1.678
2.87%
jan 1, 1971
58.104
-2.058
-3.42%
jan 1, 1972
54.92
-3.184
-5.48%
jan 1, 1973
52.844
-2.076
-3.78%
jan 1, 1974
49.726
-3.118
-5.9%
jan 1, 1975
57.292
+7.566
15.22%
jan 1, 1976
56.653
-0.638
-1.11%
jan 1, 1977
54.701
-1.953
-3.45%
jan 1, 1978
59.366
+4.665
8.53%
jan 1, 1979
57.394
-1.972
-3.32%
jan 1, 1980
61.25
+3.856
6.72%
jan 1, 1981
55.339
-5.911
-9.65%
jan 1, 1982
57.269
+1.93
3.49%
jan 1, 1983
51.102
-6.167
-10.77%
jan 1, 1984
58.593
+7.491
14.66%
jan 1, 1985
65.367
+6.775
11.56%
jan 1, 1986
65.392
+0.025
0.04%
jan 1, 1987
61.876
-3.516
-5.38%
jan 1, 1988
59.757
-2.119
-3.42%
jan 1, 1989
68.657
+8.9
14.89%
jan 1, 1990
78.929
+10.272
14.96%
jan 1, 1991
68.389
-10.54
-13.35%
jan 1, 1992
70.693
+2.304
3.37%
jan 1, 1993
67.241
-3.453
-4.88%
jan 1, 1994
66.055
-1.186
-1.76%
jan 1, 1995
63.721
-2.334
-3.53%
jan 1, 1996
60.759
-2.962
-4.65%
jan 1, 1997
58.723
-2.036
-3.35%
jan 1, 1998
59.297
+0.574
0.98%
jan 1, 1999
61.374
+2.077
3.5%
jan 1, 2000
60.174
-1.2
-1.96%
jan 1, 2001
59.491
-0.683
-1.14%
jan 1, 2002
64.384
+4.893
8.23%
jan 1, 2003
67.045
+2.661
4.13%
jan 1, 2004
62.485
-4.561
-6.8%
jan 1, 2005
65.415
+2.931
4.69%
jan 1, 2006
64.997
-0.418
-0.64%
jan 1, 2007
63.03
-1.968
-3.03%
jan 1, 2008
58.399
-4.631
-7.35%
jan 1, 2009
58.502
+0.103
0.18%
jan 1, 2010
58.169
-0.333
-0.57%
jan 1, 2011
59.717
+1.548
2.66%
jan 1, 2012
55.853
-3.864
-6.47%
jan 1, 2013
53.977
-1.876
-3.36%
jan 1, 2014
51.962
-2.016
-3.73%
jan 1, 2015
50.859
-1.102
-2.12%
Ranking of countries by current statistics by years


Comments: