29
/
en
AIzaSyAYiBZKx7MnpbEhh9jyipgxe19OcubqV5w
April 1, 2024
170048
Korea, Rep.
KOR
true
2
1
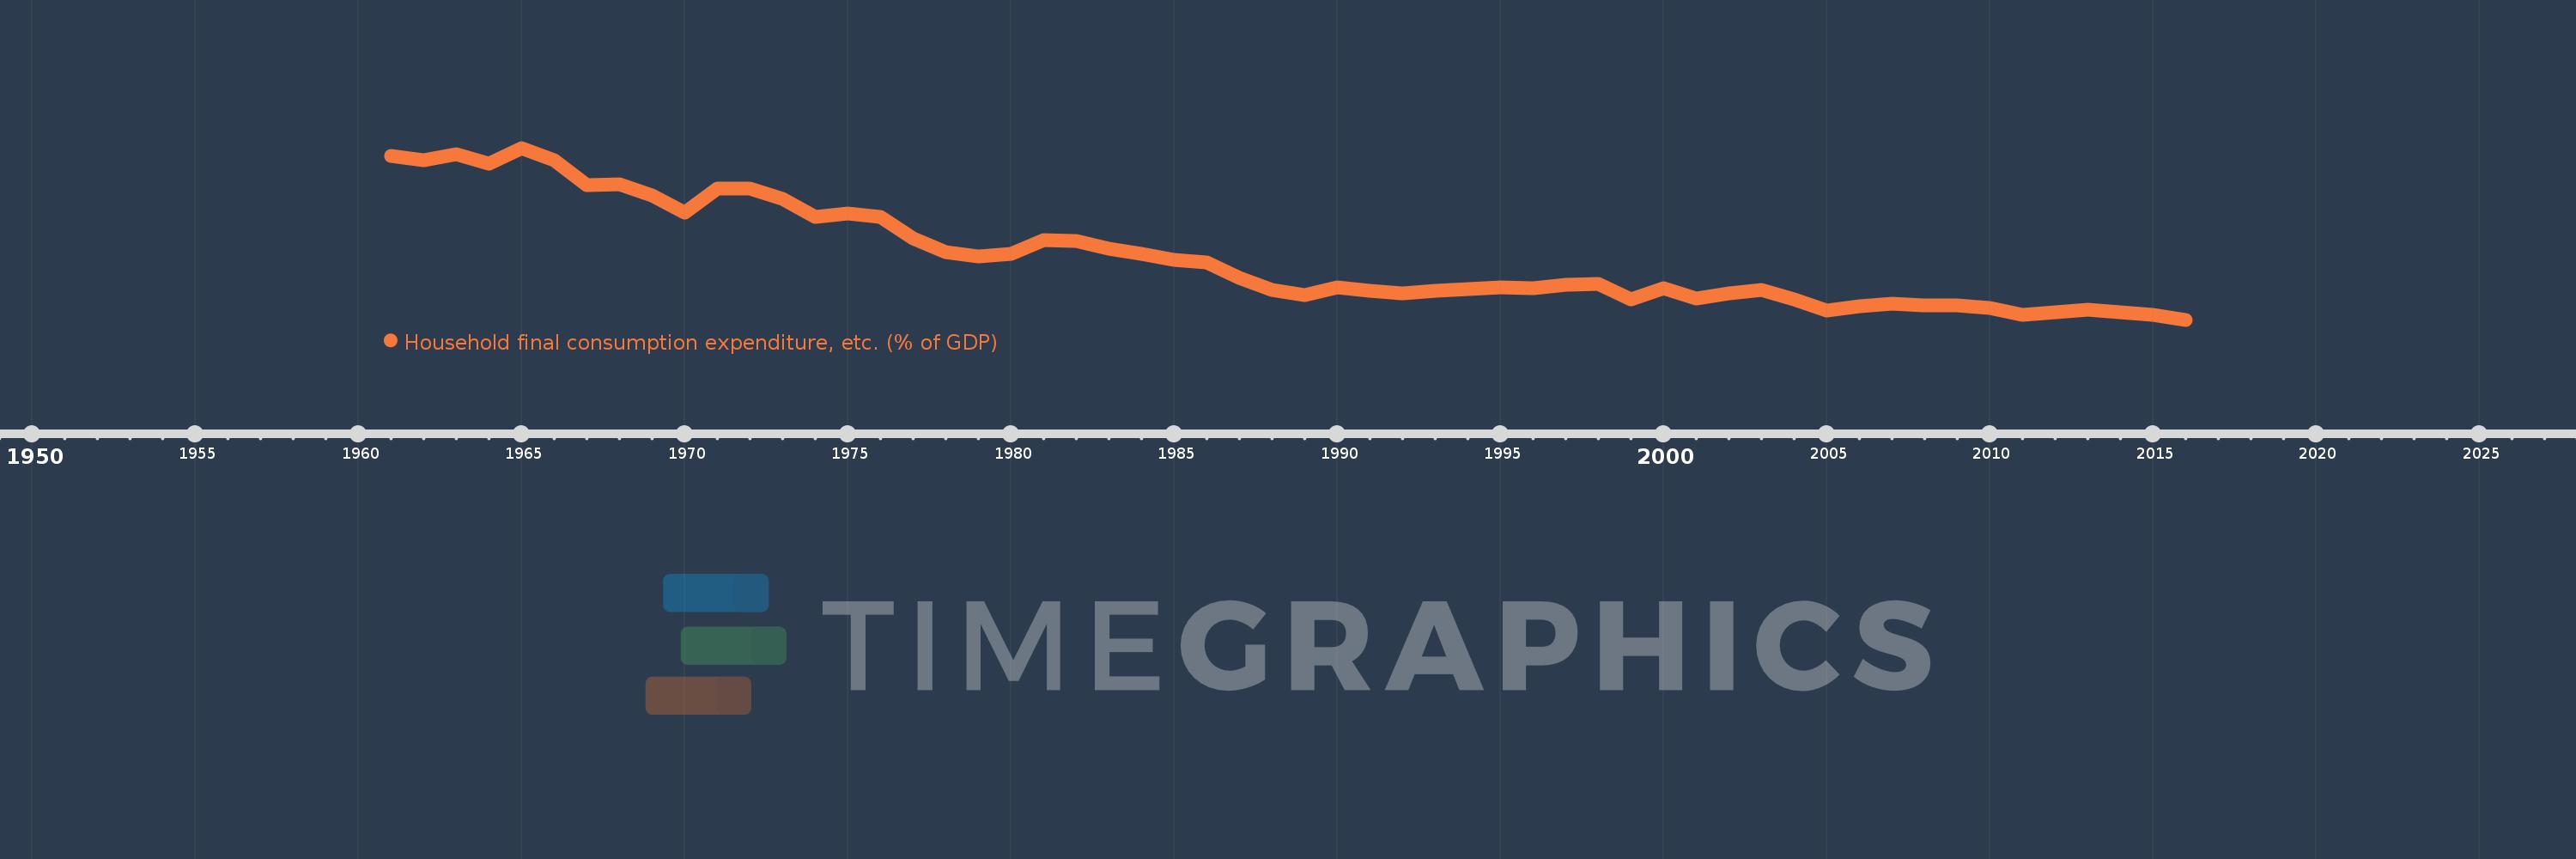
Household final consumption expenditure, etc. (% of GDP)
2016,2015,2014,2013,2012,2011,2010,2009,2008,2007,2006,2005,2004,2003,2002,2001,2000,1999,1998,1997,1996,1995,1994,1993,1992,1991,1990,1989,1988,1987,1986,1985,1984,1983,1982,1981,1980,1979,1978,1977,1976,1975,1974,1973,1972,1971,1970,1969,1968,1967,1966,1965,1964,1963,1962,1961
This statistics in other country:
AfghanistanAlbaniaAlgeriaAngolaAntigua and BarbudaArab WorldArgentinaArmeniaArubaAustraliaAustriaAzerbaijanBahamas, TheBahrainBangladeshBarbadosBelarusBelgiumBelizeBeninBermudaBhutanBoliviaBosnia and HerzegovinaBotswanaBrazilBrunei DarussalamBulgariaBurkina FasoBurundiCabo VerdeCambodiaCameroonCanadaCaribbean small statesCentral African RepublicCentral Europe and the BalticsChadChileChinaColombiaComorosCongo, Dem. Rep.Congo, Rep.Costa RicaCote d'IvoireCroatiaCubaCyprusCzech RepublicDenmarkDjiboutiDominicaDominican RepublicEarly-demographic dividendEast Asia & PacificEast Asia & Pacific (excluding high income)East Asia & Pacific (IDA & IBRD countries)EcuadorEgypt, Arab Rep.El SalvadorEquatorial GuineaEritreaEstoniaEthiopiaEuro areaEurope & Central AsiaEurope & Central Asia (excluding high income)Europe & Central Asia (IDA & IBRD countries)European UnionFaroe IslandsFijiFinlandFragile and conflict affected situationsFranceGabonGambia, TheGeorgiaGermanyGhanaGreeceGrenadaGuatemalaGuineaGuinea-BissauGuyanaHaitiHeavily indebted poor countries (HIPC)High incomeHondurasHong Kong SAR, ChinaHungaryIBRD onlyIcelandIDA & IBRD totalIDA blendIDA onlyIDA totalIndiaIndonesiaIran, Islamic Rep.IraqIrelandIsraelItalyJamaicaJapanJordanKazakhstanKenyaKiribatiKorea, Rep.KosovoKuwaitKyrgyz RepublicLao PDRLate-demographic dividendLatin America & Caribbean Latin America & Caribbean (excluding high income)Latin America & the Caribbean (IDA & IBRD countries)LatviaLeast developed countries: UN classificationLebanonLesothoLiberiaLibyaLithuaniaLow & middle incomeLow incomeLower middle incomeLuxembourgMacao SAR, ChinaMacedonia, FYRMadagascarMalawiMalaysiaMaldivesMaliMaltaMauritaniaMauritiusMexicoMicronesia, Fed. Sts.Middle East & North AfricaMiddle East & North Africa (excluding high income)Middle East & North Africa (IDA & IBRD countries)Middle incomeMoldovaMongoliaMontenegroMoroccoMozambiqueNamibiaNepalNetherlandsNew CaledoniaNew ZealandNicaraguaNigerNigeriaNorth AmericaNorwayOECD membersOmanOther small statesPacific island small statesPakistanPanamaPapua New GuineaParaguayPeruPhilippinesPolandPortugalPost-demographic dividendPre-demographic dividendPuerto RicoQatarRomaniaRussian FederationRwandaSaudi ArabiaSenegalSerbiaSeychellesSierra LeoneSingaporeSlovak RepublicSloveniaSmall statesSolomon IslandsSomaliaSouth AfricaSouth AsiaSouth Asia (IDA & IBRD)South SudanSpainSri LankaSt. Kitts and NevisSt. LuciaSt. Vincent and the GrenadinesSub-Saharan Africa Sub-Saharan Africa (excluding high income)Sub-Saharan Africa (IDA & IBRD countries)SudanSurinameSwazilandSwedenSwitzerlandSyrian Arab RepublicTajikistanTanzaniaThailandTimor-LesteTogoTongaTrinidad and TobagoTunisiaTurkeyTurkmenistanUgandaUkraineUnited Arab EmiratesUnited KingdomUnited StatesUpper middle incomeUruguayUzbekistanVanuatuVenezuela, RBVietnamWest Bank and GazaWorldYemen, Rep.ZambiaZimbabwe Timeline:
This timeline shows a graph from 1961 to 2016 of Korea, Rep.. No data until 1960. Number of actual observations by date: 56.
Source name:
World Development Indicators
Source organization:
World Bank national accounts data, and OECD National Accounts data files.
Categories, topics:
Economy & Growth
Last updated:
apr 23, 2017
Indicators value changes by year
Minimum:
49.338
jan 1, 2016
Maximum:
84.786
jan 1, 1965
At the date of observation
Value
Absolute change
Change from previous value
jan 1, 1961
83.095
+83.095
0.0%
jan 1, 1962
82.257
-0.837
-1.01%
jan 1, 1963
83.437
+1.18
1.43%
jan 1, 1964
81.592
-1.845
-2.21%
jan 1, 1965
84.786
+3.194
3.91%
jan 1, 1966
82.175
-2.611
-3.08%
jan 1, 1967
77.097
-5.078
-6.18%
jan 1, 1968
77.204
+0.107
0.14%
jan 1, 1969
74.989
-2.216
-2.87%
jan 1, 1970
71.455
-3.534
-4.71%
jan 1, 1971
76.433
+4.978
6.97%
jan 1, 1972
76.404
-0.029
-0.04%
jan 1, 1973
74.323
-2.081
-2.72%
jan 1, 1974
70.594
-3.729
-5.02%
jan 1, 1975
71.287
+0.694
0.98%
jan 1, 1976
70.477
-0.811
-1.14%
jan 1, 1977
66.2
-4.277
-6.07%
jan 1, 1978
63.259
-2.94
-4.44%
jan 1, 1979
62.474
-0.786
-1.24%
jan 1, 1980
62.929
+0.455
0.73%
jan 1, 1981
65.773
+2.845
4.52%
jan 1, 1982
65.631
-0.142
-0.22%
jan 1, 1983
64.017
-1.614
-2.46%
jan 1, 1984
62.923
-1.095
-1.71%
jan 1, 1985
61.662
-1.26
-2.0%
jan 1, 1986
61.093
-0.569
-0.92%
jan 1, 1987
58.035
-3.059
-5.01%
jan 1, 1988
55.415
-2.619
-4.51%
jan 1, 1989
54.347
-1.069
-1.93%
jan 1, 1990
55.99
+1.644
3.02%
jan 1, 1991
55.304
-0.687
-1.23%
jan 1, 1992
54.825
-0.479
-0.87%
jan 1, 1993
55.369
+0.545
0.99%
jan 1, 1994
55.688
+0.319
0.58%
jan 1, 1995
56.006
+0.318
0.57%
jan 1, 1996
55.827
-0.178
-0.32%
jan 1, 1997
56.546
+0.718
1.29%
jan 1, 1998
56.778
+0.233
0.41%
jan 1, 1999
53.509
-3.269
-5.76%
jan 1, 2000
55.93
+2.421
4.52%
jan 1, 2001
53.649
-2.281
-4.08%
jan 1, 2002
54.7
+1.05
1.96%
jan 1, 2003
55.426
+0.726
1.33%
jan 1, 2004
53.506
-1.92
-3.46%
jan 1, 2005
51.265
-2.241
-4.19%
jan 1, 2006
52.119
+0.854
1.67%
jan 1, 2007
52.699
+0.58
1.11%
jan 1, 2008
52.366
-0.333
-0.63%
jan 1, 2009
52.347
-0.018
-0.03%
jan 1, 2010
51.678
-0.669
-1.28%
jan 1, 2011
50.321
-1.357
-2.63%
jan 1, 2012
50.961
+0.64
1.27%
jan 1, 2013
51.371
+0.41
0.81%
jan 1, 2014
50.915
-0.456
-0.89%
jan 1, 2015
50.347
-0.568
-1.11%
jan 1, 2016
49.338
-1.01
-2.01%
Ranking of countries by current statistics by years


Comments: