29
/
en
AIzaSyAYiBZKx7MnpbEhh9jyipgxe19OcubqV5w
April 1, 2024
210470
Nicaragua
NIC
true
2
1
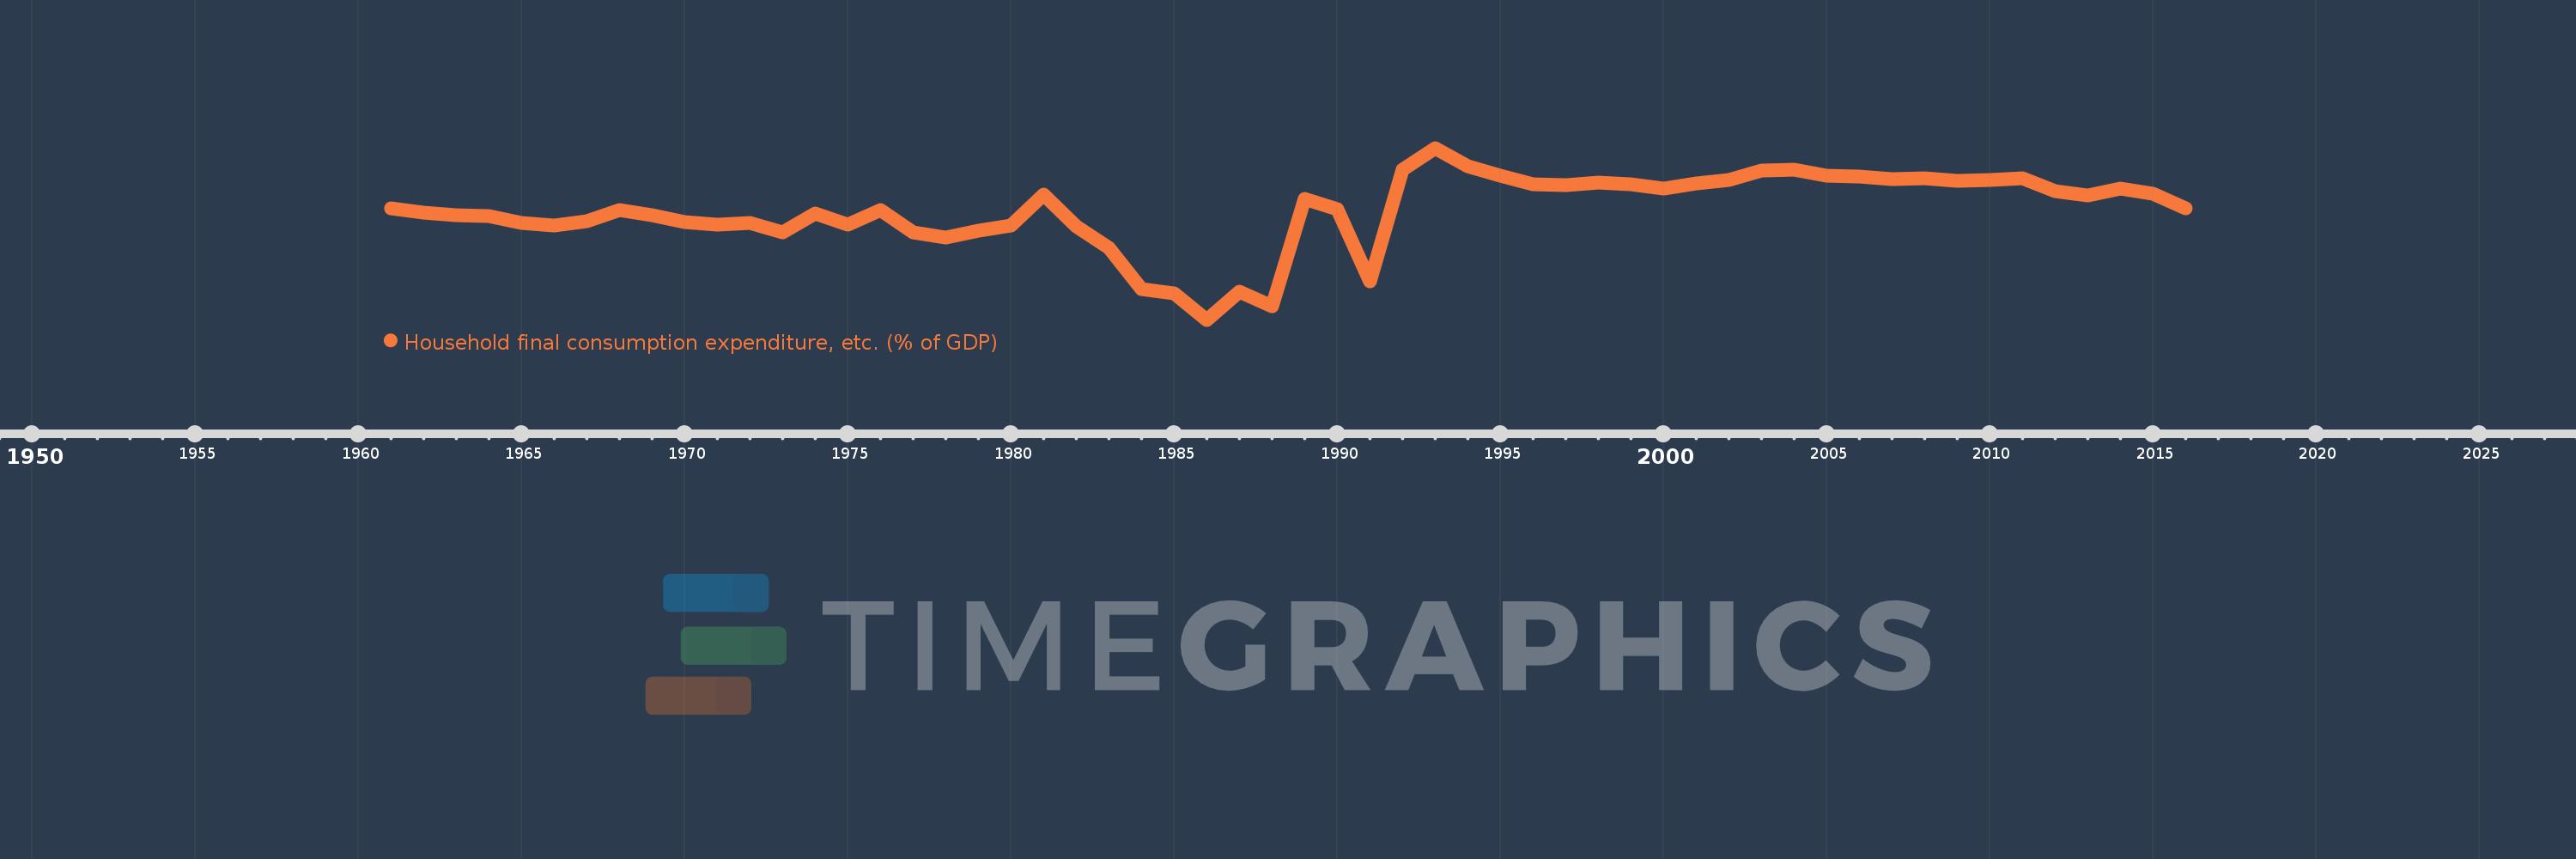
Household final consumption expenditure, etc. (% of GDP)
2016,2015,2014,2013,2012,2011,2010,2009,2008,2007,2006,2005,2004,2003,2002,2001,2000,1999,1998,1997,1996,1995,1994,1993,1992,1991,1990,1989,1988,1987,1986,1985,1984,1983,1982,1981,1980,1979,1978,1977,1976,1975,1974,1973,1972,1971,1970,1969,1968,1967,1966,1965,1964,1963,1962,1961
This statistics in other country:
AfghanistanAlbaniaAlgeriaAngolaAntigua and BarbudaArab WorldArgentinaArmeniaArubaAustraliaAustriaAzerbaijanBahamas, TheBahrainBangladeshBarbadosBelarusBelgiumBelizeBeninBermudaBhutanBoliviaBosnia and HerzegovinaBotswanaBrazilBrunei DarussalamBulgariaBurkina FasoBurundiCabo VerdeCambodiaCameroonCanadaCaribbean small statesCentral African RepublicCentral Europe and the BalticsChadChileChinaColombiaComorosCongo, Dem. Rep.Congo, Rep.Costa RicaCote d'IvoireCroatiaCubaCyprusCzech RepublicDenmarkDjiboutiDominicaDominican RepublicEarly-demographic dividendEast Asia & PacificEast Asia & Pacific (excluding high income)East Asia & Pacific (IDA & IBRD countries)EcuadorEgypt, Arab Rep.El SalvadorEquatorial GuineaEritreaEstoniaEthiopiaEuro areaEurope & Central AsiaEurope & Central Asia (excluding high income)Europe & Central Asia (IDA & IBRD countries)European UnionFaroe IslandsFijiFinlandFragile and conflict affected situationsFranceGabonGambia, TheGeorgiaGermanyGhanaGreeceGrenadaGuatemalaGuineaGuinea-BissauGuyanaHaitiHeavily indebted poor countries (HIPC)High incomeHondurasHong Kong SAR, ChinaHungaryIBRD onlyIcelandIDA & IBRD totalIDA blendIDA onlyIDA totalIndiaIndonesiaIran, Islamic Rep.IraqIrelandIsraelItalyJamaicaJapanJordanKazakhstanKenyaKiribatiKorea, Rep.KosovoKuwaitKyrgyz RepublicLao PDRLate-demographic dividendLatin America & Caribbean Latin America & Caribbean (excluding high income)Latin America & the Caribbean (IDA & IBRD countries)LatviaLeast developed countries: UN classificationLebanonLesothoLiberiaLibyaLithuaniaLow & middle incomeLow incomeLower middle incomeLuxembourgMacao SAR, ChinaMacedonia, FYRMadagascarMalawiMalaysiaMaldivesMaliMaltaMauritaniaMauritiusMexicoMicronesia, Fed. Sts.Middle East & North AfricaMiddle East & North Africa (excluding high income)Middle East & North Africa (IDA & IBRD countries)Middle incomeMoldovaMongoliaMontenegroMoroccoMozambiqueNamibiaNepalNetherlandsNew CaledoniaNew ZealandNicaraguaNigerNigeriaNorth AmericaNorwayOECD membersOmanOther small statesPacific island small statesPakistanPanamaPapua New GuineaParaguayPeruPhilippinesPolandPortugalPost-demographic dividendPre-demographic dividendPuerto RicoQatarRomaniaRussian FederationRwandaSaudi ArabiaSenegalSerbiaSeychellesSierra LeoneSingaporeSlovak RepublicSloveniaSmall statesSolomon IslandsSomaliaSouth AfricaSouth AsiaSouth Asia (IDA & IBRD)South SudanSpainSri LankaSt. Kitts and NevisSt. LuciaSt. Vincent and the GrenadinesSub-Saharan Africa Sub-Saharan Africa (excluding high income)Sub-Saharan Africa (IDA & IBRD countries)SudanSurinameSwazilandSwedenSwitzerlandSyrian Arab RepublicTajikistanTanzaniaThailandTimor-LesteTogoTongaTrinidad and TobagoTunisiaTurkeyTurkmenistanUgandaUkraineUnited Arab EmiratesUnited KingdomUnited StatesUpper middle incomeUruguayUzbekistanVanuatuVenezuela, RBVietnamWest Bank and GazaWorldYemen, Rep.ZambiaZimbabwe Timeline:
This timeline shows a graph from 1961 to 2016 of Nicaragua. No data until 1960. Number of actual observations by date: 56.
Source name:
World Development Indicators
Source organization:
World Bank national accounts data, and OECD National Accounts data files.
Categories, topics:
Economy & Growth
Last updated:
apr 23, 2017
Indicators value changes by year
Minimum:
48.191
jan 1, 1986
Maximum:
95.418
jan 1, 1993
At the date of observation
Value
Absolute change
Change from previous value
jan 1, 1961
78.867
+78.867
0.0%
jan 1, 1962
77.754
-1.113
-1.41%
jan 1, 1963
76.95
-0.804
-1.03%
jan 1, 1964
76.679
-0.271
-0.35%
jan 1, 1965
74.864
-1.815
-2.37%
jan 1, 1966
74.204
-0.659
-0.88%
jan 1, 1967
75.369
+1.165
1.57%
jan 1, 1968
78.264
+2.895
3.84%
jan 1, 1969
76.959
-1.305
-1.67%
jan 1, 1970
75.091
-1.868
-2.43%
jan 1, 1971
74.274
-0.817
-1.09%
jan 1, 1972
74.794
+0.52
0.7%
jan 1, 1973
72.111
-2.683
-3.59%
jan 1, 1974
77.475
+5.364
7.44%
jan 1, 1975
74.319
-3.156
-4.07%
jan 1, 1976
78.43
+4.111
5.53%
jan 1, 1977
72.188
-6.242
-7.96%
jan 1, 1978
70.804
-1.384
-1.92%
jan 1, 1979
72.747
+1.942
2.74%
jan 1, 1980
73.997
+1.25
1.72%
jan 1, 1981
82.533
+8.536
11.54%
jan 1, 1982
73.905
-8.628
-10.45%
jan 1, 1983
67.856
-6.049
-8.18%
jan 1, 1984
56.667
-11.189
-16.49%
jan 1, 1985
55.441
-1.226
-2.16%
jan 1, 1986
48.191
-7.25
-13.08%
jan 1, 1987
55.811
+7.621
15.81%
jan 1, 1988
51.958
-3.854
-6.9%
jan 1, 1989
81.33
+29.372
56.53%
jan 1, 1990
78.496
-2.834
-3.48%
jan 1, 1991
58.639
-19.857
-25.3%
jan 1, 1992
89.357
+30.718
52.38%
jan 1, 1993
95.418
+6.061
6.78%
jan 1, 1994
90.375
-5.043
-5.29%
jan 1, 1995
87.779
-2.596
-2.87%
jan 1, 1996
85.404
-2.375
-2.71%
jan 1, 1997
85.266
-0.138
-0.16%
jan 1, 1998
85.966
+0.699
0.82%
jan 1, 1999
85.394
-0.571
-0.66%
jan 1, 2000
84.247
-1.148
-1.34%
jan 1, 2001
85.751
+1.504
1.79%
jan 1, 2002
86.627
+0.876
1.02%
jan 1, 2003
89.22
+2.593
2.99%
jan 1, 2004
89.33
+0.11
0.12%
jan 1, 2005
87.88
-1.449
-1.62%
jan 1, 2006
87.568
-0.312
-0.36%
jan 1, 2007
86.937
-0.631
-0.72%
jan 1, 2008
87.146
+0.209
0.24%
jan 1, 2009
86.42
-0.727
-0.83%
jan 1, 2010
86.637
+0.217
0.25%
jan 1, 2011
87.108
+0.471
0.54%
jan 1, 2012
83.475
-3.633
-4.17%
jan 1, 2013
82.437
-1.037
-1.24%
jan 1, 2014
84.137
+1.699
2.06%
jan 1, 2015
82.778
-1.358
-1.61%
jan 1, 2016
78.882
-3.896
-4.71%
Ranking of countries by current statistics by years


Comments: