29
/
en
AIzaSyAYiBZKx7MnpbEhh9jyipgxe19OcubqV5w
April 1, 2024
226000
Portugal
PRT
true
2
1
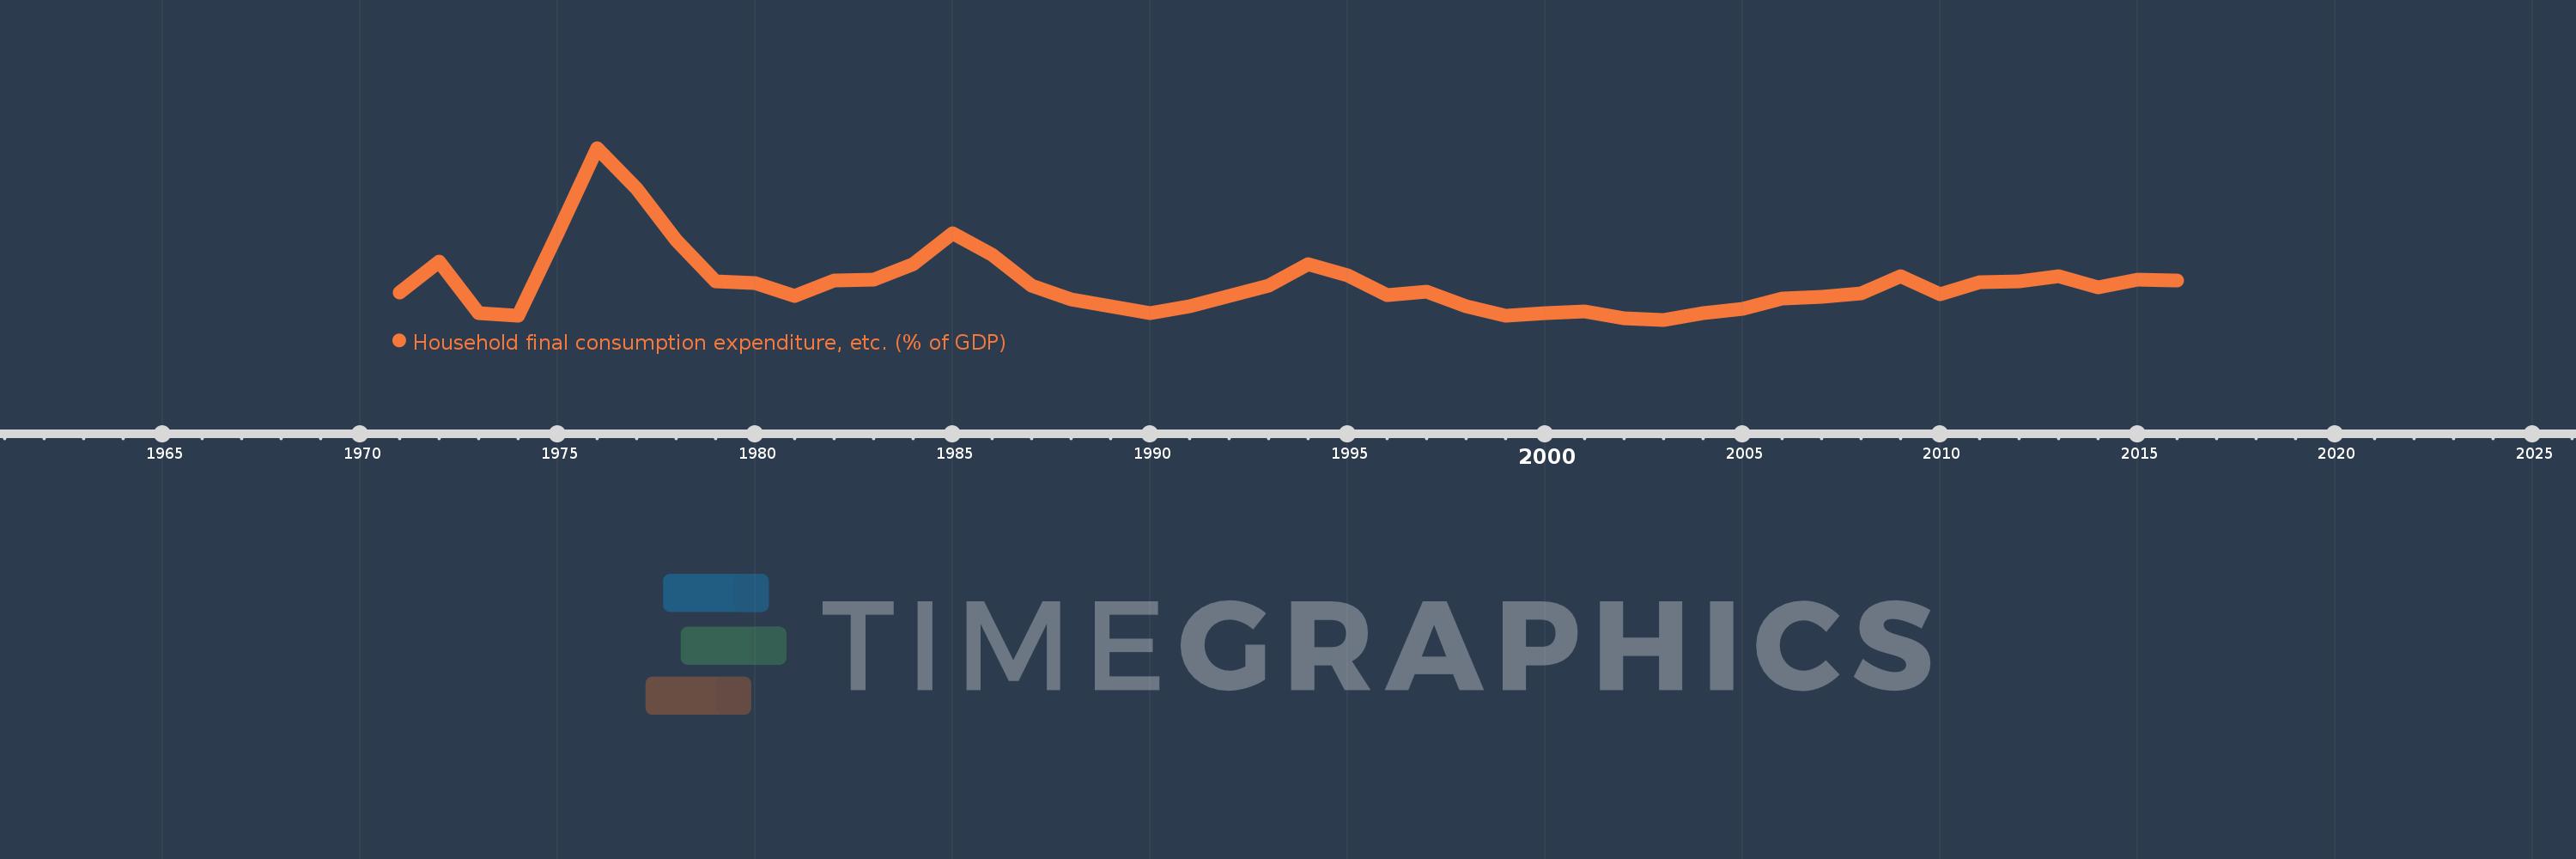
Household final consumption expenditure, etc. (% of GDP)
2016,2015,2014,2013,2012,2011,2010,2009,2008,2007,2006,2005,2004,2003,2002,2001,2000,1999,1998,1997,1996,1995,1994,1993,1992,1991,1990,1989,1988,1987,1986,1985,1984,1983,1982,1981,1980,1979,1978,1977,1976,1975,1974,1973,1972,1971
This statistics in other country:
AfghanistanAlbaniaAlgeriaAngolaAntigua and BarbudaArab WorldArgentinaArmeniaArubaAustraliaAustriaAzerbaijanBahamas, TheBahrainBangladeshBarbadosBelarusBelgiumBelizeBeninBermudaBhutanBoliviaBosnia and HerzegovinaBotswanaBrazilBrunei DarussalamBulgariaBurkina FasoBurundiCabo VerdeCambodiaCameroonCanadaCaribbean small statesCentral African RepublicCentral Europe and the BalticsChadChileChinaColombiaComorosCongo, Dem. Rep.Congo, Rep.Costa RicaCote d'IvoireCroatiaCubaCyprusCzech RepublicDenmarkDjiboutiDominicaDominican RepublicEarly-demographic dividendEast Asia & PacificEast Asia & Pacific (excluding high income)East Asia & Pacific (IDA & IBRD countries)EcuadorEgypt, Arab Rep.El SalvadorEquatorial GuineaEritreaEstoniaEthiopiaEuro areaEurope & Central AsiaEurope & Central Asia (excluding high income)Europe & Central Asia (IDA & IBRD countries)European UnionFaroe IslandsFijiFinlandFragile and conflict affected situationsFranceGabonGambia, TheGeorgiaGermanyGhanaGreeceGrenadaGuatemalaGuineaGuinea-BissauGuyanaHaitiHeavily indebted poor countries (HIPC)High incomeHondurasHong Kong SAR, ChinaHungaryIBRD onlyIcelandIDA & IBRD totalIDA blendIDA onlyIDA totalIndiaIndonesiaIran, Islamic Rep.IraqIrelandIsraelItalyJamaicaJapanJordanKazakhstanKenyaKiribatiKorea, Rep.KosovoKuwaitKyrgyz RepublicLao PDRLate-demographic dividendLatin America & Caribbean Latin America & Caribbean (excluding high income)Latin America & the Caribbean (IDA & IBRD countries)LatviaLeast developed countries: UN classificationLebanonLesothoLiberiaLibyaLithuaniaLow & middle incomeLow incomeLower middle incomeLuxembourgMacao SAR, ChinaMacedonia, FYRMadagascarMalawiMalaysiaMaldivesMaliMaltaMauritaniaMauritiusMexicoMicronesia, Fed. Sts.Middle East & North AfricaMiddle East & North Africa (excluding high income)Middle East & North Africa (IDA & IBRD countries)Middle incomeMoldovaMongoliaMontenegroMoroccoMozambiqueNamibiaNepalNetherlandsNew CaledoniaNew ZealandNicaraguaNigerNigeriaNorth AmericaNorwayOECD membersOmanOther small statesPacific island small statesPakistanPanamaPapua New GuineaParaguayPeruPhilippinesPolandPortugalPost-demographic dividendPre-demographic dividendPuerto RicoQatarRomaniaRussian FederationRwandaSaudi ArabiaSenegalSerbiaSeychellesSierra LeoneSingaporeSlovak RepublicSloveniaSmall statesSolomon IslandsSomaliaSouth AfricaSouth AsiaSouth Asia (IDA & IBRD)South SudanSpainSri LankaSt. Kitts and NevisSt. LuciaSt. Vincent and the GrenadinesSub-Saharan Africa Sub-Saharan Africa (excluding high income)Sub-Saharan Africa (IDA & IBRD countries)SudanSurinameSwazilandSwedenSwitzerlandSyrian Arab RepublicTajikistanTanzaniaThailandTimor-LesteTogoTongaTrinidad and TobagoTunisiaTurkeyTurkmenistanUgandaUkraineUnited Arab EmiratesUnited KingdomUnited StatesUpper middle incomeUruguayUzbekistanVanuatuVenezuela, RBVietnamWest Bank and GazaWorldYemen, Rep.ZambiaZimbabwe Timeline:
This timeline shows a graph from 1971 to 2016 of Portugal. No data until 1970. Number of actual observations by date: 46.
Source name:
World Development Indicators
Source organization:
World Bank national accounts data, and OECD National Accounts data files.
Categories, topics:
Economy & Growth
Last updated:
apr 23, 2017
Indicators value changes by year
Minimum:
62.586
jan 1, 2003
Maximum:
77.023
jan 1, 1976
At the date of observation
Value
Absolute change
Change from previous value
jan 1, 1971
64.839
+64.839
0.0%
jan 1, 1972
67.44
+2.6
4.01%
jan 1, 1973
63.127
-4.312
-6.39%
jan 1, 1974
62.901
-0.227
-0.36%
jan 1, 1975
69.859
+6.958
11.06%
jan 1, 1976
77.023
+7.164
10.26%
jan 1, 1977
73.609
-3.414
-4.43%
jan 1, 1978
69.267
-4.341
-5.9%
jan 1, 1979
65.811
-3.456
-4.99%
jan 1, 1980
65.637
-0.175
-0.27%
jan 1, 1981
64.595
-1.042
-1.59%
jan 1, 1982
65.915
+1.319
2.04%
jan 1, 1983
65.972
+0.058
0.09%
jan 1, 1984
67.273
+1.301
1.97%
jan 1, 1985
69.856
+2.583
3.84%
jan 1, 1986
68.057
-1.799
-2.58%
jan 1, 1987
65.43
-2.627
-3.86%
jan 1, 1988
64.264
-1.166
-1.78%
jan 1, 1989
63.691
-0.573
-0.89%
jan 1, 1990
63.163
-0.528
-0.83%
jan 1, 1991
63.729
+0.566
0.9%
jan 1, 1992
64.579
+0.85
1.33%
jan 1, 1993
65.461
+0.882
1.37%
jan 1, 1994
67.255
+1.794
2.74%
jan 1, 1995
66.328
-0.927
-1.38%
jan 1, 1996
64.631
-1.697
-2.56%
jan 1, 1997
64.947
+0.316
0.49%
jan 1, 1998
63.746
-1.202
-1.85%
jan 1, 1999
62.895
-0.851
-1.33%
jan 1, 2000
63.167
+0.273
0.43%
jan 1, 2001
63.255
+0.088
0.14%
jan 1, 2002
62.683
-0.572
-0.9%
jan 1, 2003
62.586
-0.097
-0.15%
jan 1, 2004
63.108
+0.522
0.83%
jan 1, 2005
63.531
+0.422
0.67%
jan 1, 2006
64.358
+0.827
1.3%
jan 1, 2007
64.544
+0.186
0.29%
jan 1, 2008
64.805
+0.262
0.41%
jan 1, 2009
66.243
+1.437
2.22%
jan 1, 2010
64.697
-1.546
-2.33%
jan 1, 2011
65.764
+1.067
1.65%
jan 1, 2012
65.825
+0.061
0.09%
jan 1, 2013
66.278
+0.453
0.69%
jan 1, 2014
65.275
-1.002
-1.51%
jan 1, 2015
65.934
+0.659
1.01%
jan 1, 2016
65.871
-0.063
-0.1%
Ranking of countries by current statistics by years


Comments: