29
/
en
AIzaSyAYiBZKx7MnpbEhh9jyipgxe19OcubqV5w
April 1, 2024
49072
Middle East & North Africa (excluding high income)
MNA
false
2
1
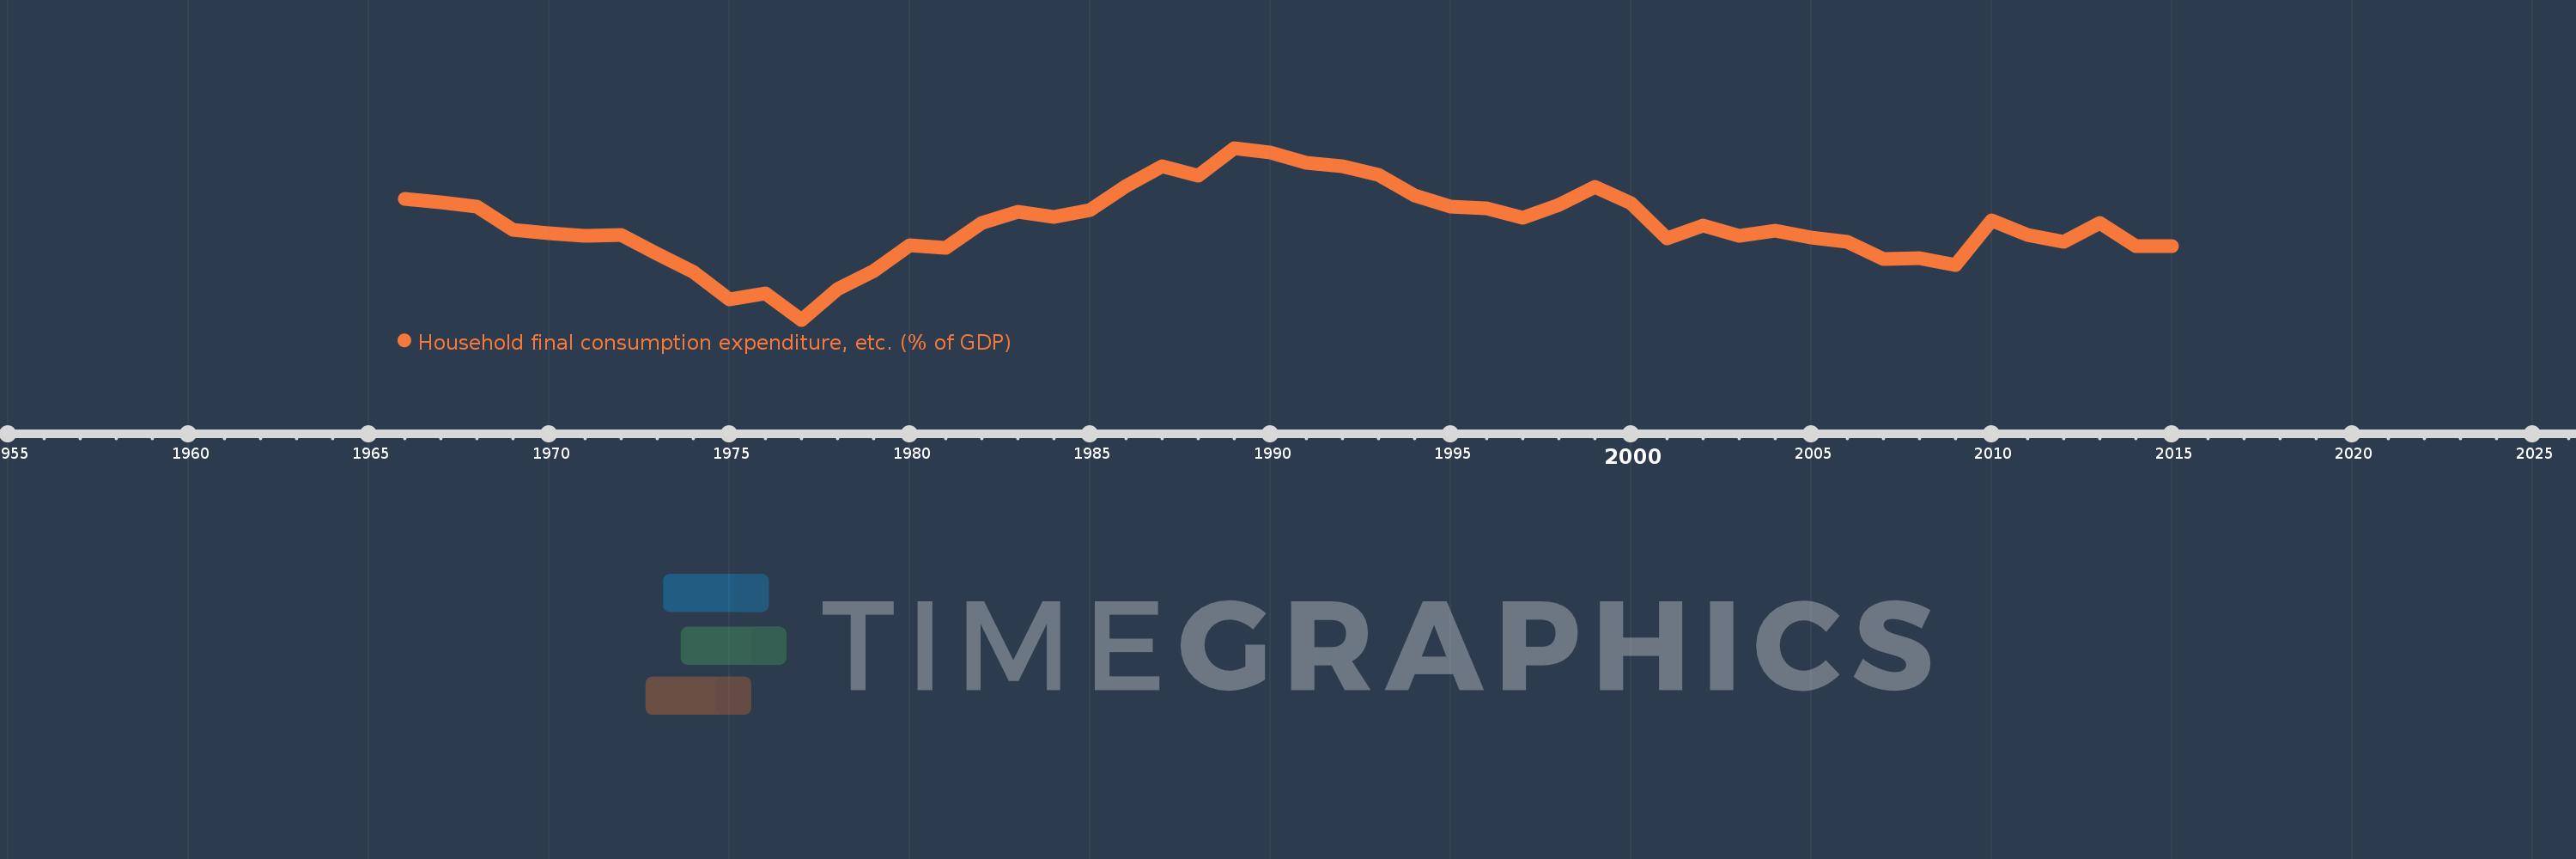
Household final consumption expenditure, etc. (% of GDP)
2015,2014,2013,2012,2011,2010,2009,2008,2007,2006,2005,2004,2003,2002,2001,2000,1999,1998,1997,1996,1995,1994,1993,1992,1991,1990,1989,1988,1987,1986,1985,1984,1983,1982,1981,1980,1979,1978,1977,1976,1975,1974,1973,1972,1971,1970,1969,1968,1967,1966
This statistics in other country:
AfghanistanAlbaniaAlgeriaAngolaAntigua and BarbudaArab WorldArgentinaArmeniaArubaAustraliaAustriaAzerbaijanBahamas, TheBahrainBangladeshBarbadosBelarusBelgiumBelizeBeninBermudaBhutanBoliviaBosnia and HerzegovinaBotswanaBrazilBrunei DarussalamBulgariaBurkina FasoBurundiCabo VerdeCambodiaCameroonCanadaCaribbean small statesCentral African RepublicCentral Europe and the BalticsChadChileChinaColombiaComorosCongo, Dem. Rep.Congo, Rep.Costa RicaCote d'IvoireCroatiaCubaCyprusCzech RepublicDenmarkDjiboutiDominicaDominican RepublicEarly-demographic dividendEast Asia & PacificEast Asia & Pacific (excluding high income)East Asia & Pacific (IDA & IBRD countries)EcuadorEgypt, Arab Rep.El SalvadorEquatorial GuineaEritreaEstoniaEthiopiaEuro areaEurope & Central AsiaEurope & Central Asia (excluding high income)Europe & Central Asia (IDA & IBRD countries)European UnionFaroe IslandsFijiFinlandFragile and conflict affected situationsFranceGabonGambia, TheGeorgiaGermanyGhanaGreeceGrenadaGuatemalaGuineaGuinea-BissauGuyanaHaitiHeavily indebted poor countries (HIPC)High incomeHondurasHong Kong SAR, ChinaHungaryIBRD onlyIcelandIDA & IBRD totalIDA blendIDA onlyIDA totalIndiaIndonesiaIran, Islamic Rep.IraqIrelandIsraelItalyJamaicaJapanJordanKazakhstanKenyaKiribatiKorea, Rep.KosovoKuwaitKyrgyz RepublicLao PDRLate-demographic dividendLatin America & Caribbean Latin America & Caribbean (excluding high income)Latin America & the Caribbean (IDA & IBRD countries)LatviaLeast developed countries: UN classificationLebanonLesothoLiberiaLibyaLithuaniaLow & middle incomeLow incomeLower middle incomeLuxembourgMacao SAR, ChinaMacedonia, FYRMadagascarMalawiMalaysiaMaldivesMaliMaltaMauritaniaMauritiusMexicoMicronesia, Fed. Sts.Middle East & North AfricaMiddle East & North Africa (excluding high income)Middle East & North Africa (IDA & IBRD countries)Middle incomeMoldovaMongoliaMontenegroMoroccoMozambiqueNamibiaNepalNetherlandsNew CaledoniaNew ZealandNicaraguaNigerNigeriaNorth AmericaNorwayOECD membersOmanOther small statesPacific island small statesPakistanPanamaPapua New GuineaParaguayPeruPhilippinesPolandPortugalPost-demographic dividendPre-demographic dividendPuerto RicoQatarRomaniaRussian FederationRwandaSaudi ArabiaSenegalSerbiaSeychellesSierra LeoneSingaporeSlovak RepublicSloveniaSmall statesSolomon IslandsSomaliaSouth AfricaSouth AsiaSouth Asia (IDA & IBRD)South SudanSpainSri LankaSt. Kitts and NevisSt. LuciaSt. Vincent and the GrenadinesSub-Saharan Africa Sub-Saharan Africa (excluding high income)Sub-Saharan Africa (IDA & IBRD countries)SudanSurinameSwazilandSwedenSwitzerlandSyrian Arab RepublicTajikistanTanzaniaThailandTimor-LesteTogoTongaTrinidad and TobagoTunisiaTurkeyTurkmenistanUgandaUkraineUnited Arab EmiratesUnited KingdomUnited StatesUpper middle incomeUruguayUzbekistanVanuatuVenezuela, RBVietnamWest Bank and GazaWorldYemen, Rep.ZambiaZimbabwe Timeline:
This timeline shows a graph from 1966 to 2015 of Middle East & North Africa (excluding high income). No data until 1965. Number of actual observations by date: 50.
Source name:
World Development Indicators
Source organization:
World Bank national accounts data, and OECD National Accounts data files.
Categories, topics:
Economy & Growth
Last updated:
apr 23, 2017
Indicators value changes by year
Minimum:
42.132
jan 1, 1977
Maximum:
69.508
jan 1, 1989
At the date of observation
Value
Absolute change
Change from previous value
jan 1, 1966
61.438
+61.438
0.0%
jan 1, 1967
60.876
-0.561
-0.91%
jan 1, 1968
60.185
-0.692
-1.14%
jan 1, 1969
56.45
-3.735
-6.21%
jan 1, 1970
55.937
-0.513
-0.91%
jan 1, 1971
55.473
-0.464
-0.83%
jan 1, 1972
55.575
+0.102
0.18%
jan 1, 1973
52.651
-2.924
-5.26%
jan 1, 1974
49.764
-2.887
-5.48%
jan 1, 1975
45.366
-4.398
-8.84%
jan 1, 1976
46.334
+0.968
2.13%
jan 1, 1977
42.132
-4.202
-9.07%
jan 1, 1978
47.024
+4.892
11.61%
jan 1, 1979
49.915
+2.891
6.15%
jan 1, 1980
54.053
+4.138
8.29%
jan 1, 1981
53.656
-0.397
-0.74%
jan 1, 1982
57.585
+3.929
7.32%
jan 1, 1983
59.315
+1.73
3.0%
jan 1, 1984
58.506
-0.809
-1.36%
jan 1, 1985
59.581
+1.076
1.84%
jan 1, 1986
63.451
+3.87
6.49%
jan 1, 1987
66.563
+3.112
4.91%
jan 1, 1988
65.096
-1.467
-2.2%
jan 1, 1989
69.508
+4.412
6.78%
jan 1, 1990
68.743
-0.765
-1.1%
jan 1, 1991
67.175
-1.567
-2.28%
jan 1, 1992
66.605
-0.571
-0.85%
jan 1, 1993
65.214
-1.39
-2.09%
jan 1, 1994
61.976
-3.239
-4.97%
jan 1, 1995
60.093
-1.883
-3.04%
jan 1, 1996
59.841
-0.251
-0.42%
jan 1, 1997
58.4
-1.441
-2.41%
jan 1, 1998
60.416
+2.015
3.45%
jan 1, 1999
63.373
+2.958
4.9%
jan 1, 2000
60.77
-2.603
-4.11%
jan 1, 2001
55.095
-5.676
-9.34%
jan 1, 2002
57.153
+2.058
3.73%
jan 1, 2003
55.545
-1.608
-2.81%
jan 1, 2004
56.356
+0.811
1.46%
jan 1, 2005
55.294
-1.062
-1.88%
jan 1, 2006
54.597
-0.697
-1.26%
jan 1, 2007
51.77
-2.827
-5.18%
jan 1, 2008
51.995
+0.225
0.43%
jan 1, 2009
50.799
-1.197
-2.3%
jan 1, 2010
57.988
+7.189
14.15%
jan 1, 2011
55.612
-2.375
-4.1%
jan 1, 2012
54.571
-1.041
-1.87%
jan 1, 2013
57.554
+2.983
5.47%
jan 1, 2014
53.874
-3.68
-6.39%
jan 1, 2015
53.912
+0.038
0.07%
Ranking of countries by current statistics by years


Comments: