29
/
en
AIzaSyAYiBZKx7MnpbEhh9jyipgxe19OcubqV5w
April 1, 2024
160584
Israel
ISR
true
2
1
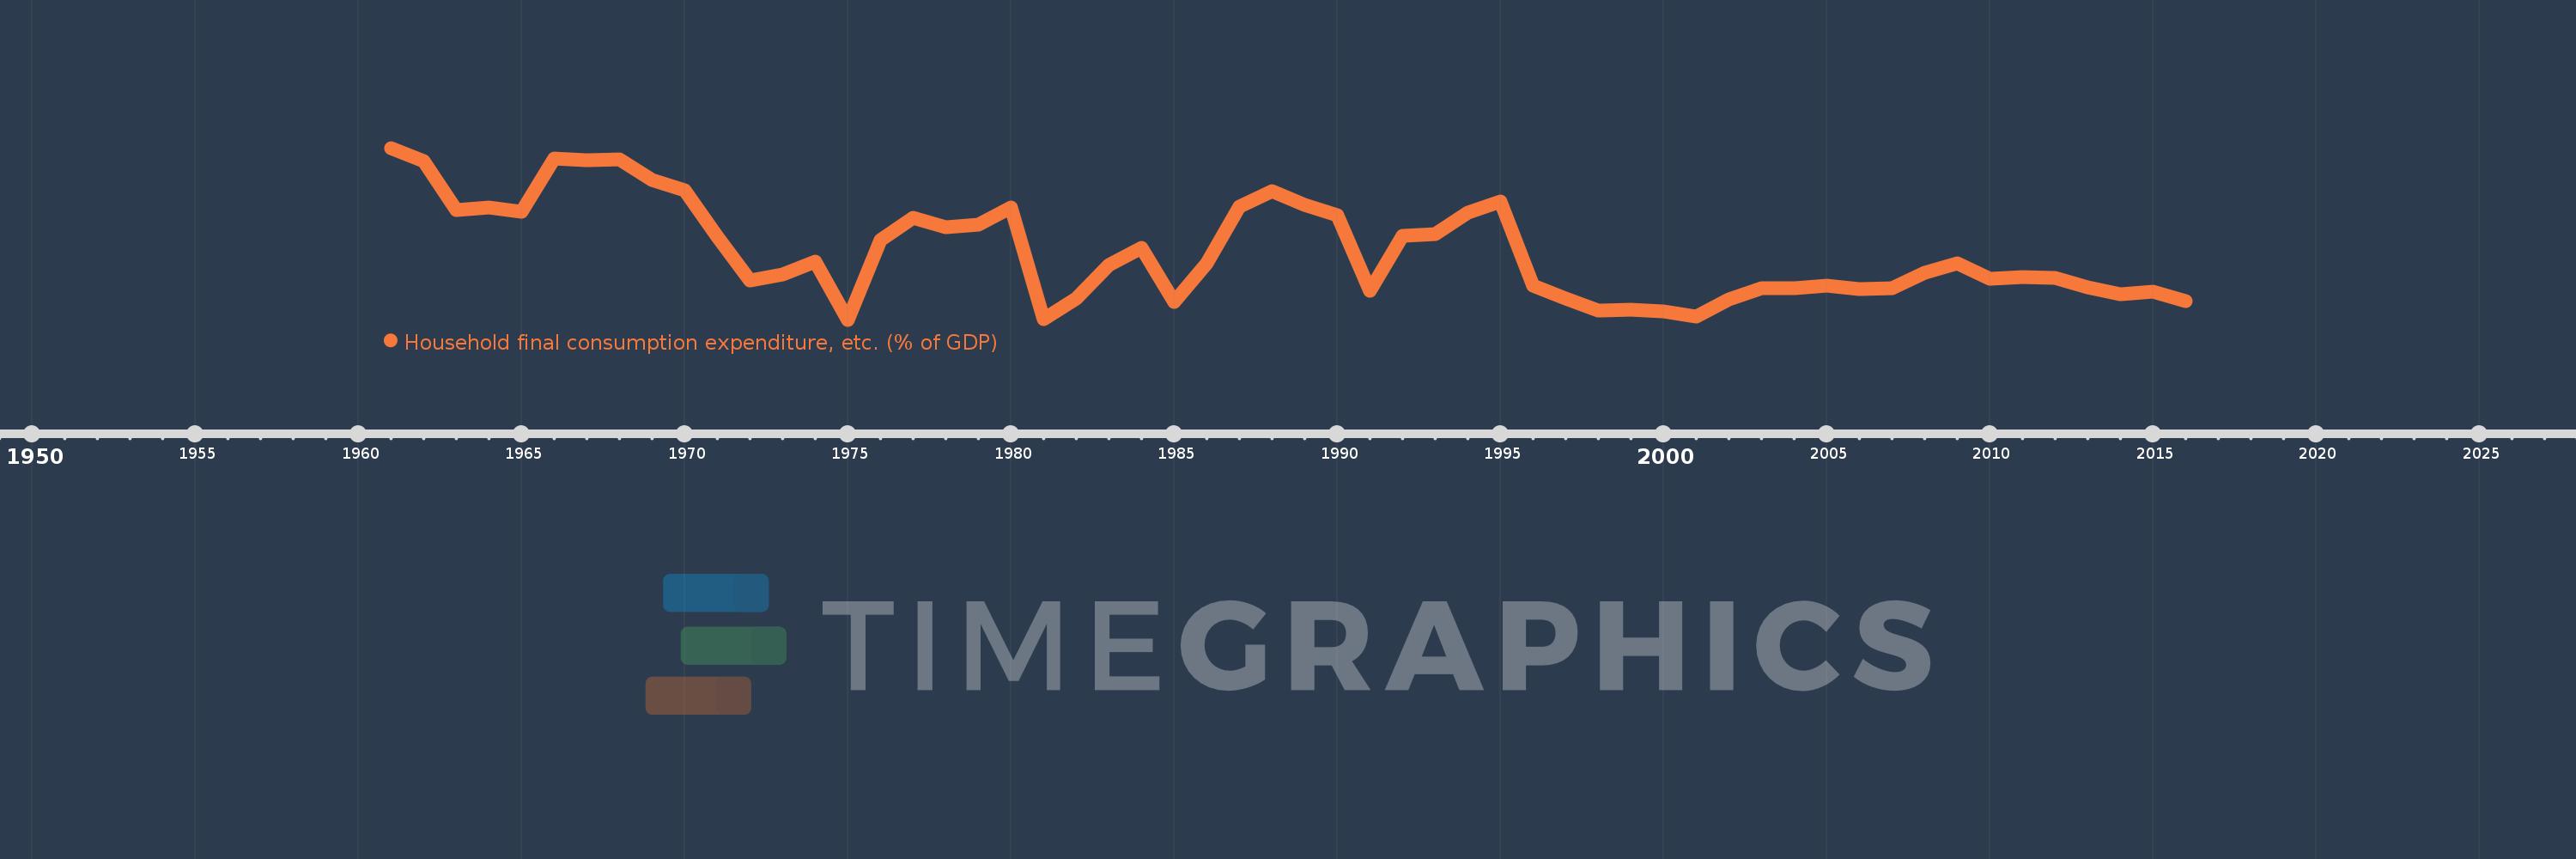
Household final consumption expenditure, etc. (% of GDP)
2016,2015,2014,2013,2012,2011,2010,2009,2008,2007,2006,2005,2004,2003,2002,2001,2000,1999,1998,1997,1996,1995,1994,1993,1992,1991,1990,1989,1988,1987,1986,1985,1984,1983,1982,1981,1980,1979,1978,1977,1976,1975,1974,1973,1972,1971,1970,1969,1968,1967,1966,1965,1964,1963,1962,1961
This statistics in other country:
AfghanistanAlbaniaAlgeriaAngolaAntigua and BarbudaArab WorldArgentinaArmeniaArubaAustraliaAustriaAzerbaijanBahamas, TheBahrainBangladeshBarbadosBelarusBelgiumBelizeBeninBermudaBhutanBoliviaBosnia and HerzegovinaBotswanaBrazilBrunei DarussalamBulgariaBurkina FasoBurundiCabo VerdeCambodiaCameroonCanadaCaribbean small statesCentral African RepublicCentral Europe and the BalticsChadChileChinaColombiaComorosCongo, Dem. Rep.Congo, Rep.Costa RicaCote d'IvoireCroatiaCubaCyprusCzech RepublicDenmarkDjiboutiDominicaDominican RepublicEarly-demographic dividendEast Asia & PacificEast Asia & Pacific (excluding high income)East Asia & Pacific (IDA & IBRD countries)EcuadorEgypt, Arab Rep.El SalvadorEquatorial GuineaEritreaEstoniaEthiopiaEuro areaEurope & Central AsiaEurope & Central Asia (excluding high income)Europe & Central Asia (IDA & IBRD countries)European UnionFaroe IslandsFijiFinlandFragile and conflict affected situationsFranceGabonGambia, TheGeorgiaGermanyGhanaGreeceGrenadaGuatemalaGuineaGuinea-BissauGuyanaHaitiHeavily indebted poor countries (HIPC)High incomeHondurasHong Kong SAR, ChinaHungaryIBRD onlyIcelandIDA & IBRD totalIDA blendIDA onlyIDA totalIndiaIndonesiaIran, Islamic Rep.IraqIrelandIsraelItalyJamaicaJapanJordanKazakhstanKenyaKiribatiKorea, Rep.KosovoKuwaitKyrgyz RepublicLao PDRLate-demographic dividendLatin America & Caribbean Latin America & Caribbean (excluding high income)Latin America & the Caribbean (IDA & IBRD countries)LatviaLeast developed countries: UN classificationLebanonLesothoLiberiaLibyaLithuaniaLow & middle incomeLow incomeLower middle incomeLuxembourgMacao SAR, ChinaMacedonia, FYRMadagascarMalawiMalaysiaMaldivesMaliMaltaMauritaniaMauritiusMexicoMicronesia, Fed. Sts.Middle East & North AfricaMiddle East & North Africa (excluding high income)Middle East & North Africa (IDA & IBRD countries)Middle incomeMoldovaMongoliaMontenegroMoroccoMozambiqueNamibiaNepalNetherlandsNew CaledoniaNew ZealandNicaraguaNigerNigeriaNorth AmericaNorwayOECD membersOmanOther small statesPacific island small statesPakistanPanamaPapua New GuineaParaguayPeruPhilippinesPolandPortugalPost-demographic dividendPre-demographic dividendPuerto RicoQatarRomaniaRussian FederationRwandaSaudi ArabiaSenegalSerbiaSeychellesSierra LeoneSingaporeSlovak RepublicSloveniaSmall statesSolomon IslandsSomaliaSouth AfricaSouth AsiaSouth Asia (IDA & IBRD)South SudanSpainSri LankaSt. Kitts and NevisSt. LuciaSt. Vincent and the GrenadinesSub-Saharan Africa Sub-Saharan Africa (excluding high income)Sub-Saharan Africa (IDA & IBRD countries)SudanSurinameSwazilandSwedenSwitzerlandSyrian Arab RepublicTajikistanTanzaniaThailandTimor-LesteTogoTongaTrinidad and TobagoTunisiaTurkeyTurkmenistanUgandaUkraineUnited Arab EmiratesUnited KingdomUnited StatesUpper middle incomeUruguayUzbekistanVanuatuVenezuela, RBVietnamWest Bank and GazaWorldYemen, Rep.ZambiaZimbabwe Timeline:
This timeline shows a graph from 1961 to 2016 of Israel. No data until 1960. Number of actual observations by date: 56.
Source name:
World Development Indicators
Source organization:
World Bank national accounts data, and OECD National Accounts data files.
Categories, topics:
Economy & Growth
Last updated:
apr 23, 2017
Indicators value changes by year
Maximum:
68.078
jan 1, 1961
At the date of observation
Value
Absolute change
Change from previous value
jan 1, 1961
68.078
+68.078
0.0%
jan 1, 1962
66.927
-1.151
-1.69%
jan 1, 1963
62.616
-4.311
-6.44%
jan 1, 1964
62.883
+0.267
0.43%
jan 1, 1965
62.471
-0.412
-0.66%
jan 1, 1966
67.134
+4.663
7.46%
jan 1, 1967
67.002
-0.132
-0.2%
jan 1, 1968
67.105
+0.103
0.15%
jan 1, 1969
65.245
-1.86
-2.77%
jan 1, 1970
64.373
-0.872
-1.34%
jan 1, 1971
60.331
-4.042
-6.28%
jan 1, 1972
56.504
-3.826
-6.34%
jan 1, 1973
56.988
+0.484
0.86%
jan 1, 1974
58.138
+1.15
2.02%
jan 1, 1975
53.05
-5.088
-8.75%
jan 1, 1976
60.01
+6.959
13.12%
jan 1, 1977
61.974
+1.964
3.27%
jan 1, 1978
61.119
-0.855
-1.38%
jan 1, 1979
61.386
+0.267
0.44%
jan 1, 1980
62.837
+1.451
2.36%
jan 1, 1981
53.107
-9.729
-15.48%
jan 1, 1982
54.869
+1.762
3.32%
jan 1, 1983
57.803
+2.934
5.35%
jan 1, 1984
59.32
+1.518
2.63%
jan 1, 1985
54.636
-4.684
-7.9%
jan 1, 1986
57.984
+3.348
6.13%
jan 1, 1987
62.909
+4.924
8.49%
jan 1, 1988
64.327
+1.418
2.25%
jan 1, 1989
63.061
-1.266
-1.97%
jan 1, 1990
62.207
-0.854
-1.35%
jan 1, 1991
55.599
-6.608
-10.62%
jan 1, 1992
60.423
+4.824
8.68%
jan 1, 1993
60.539
+0.115
0.19%
jan 1, 1994
62.428
+1.889
3.12%
jan 1, 1995
63.37
+0.942
1.51%
jan 1, 1996
56.013
-7.357
-11.61%
jan 1, 1997
54.904
-1.109
-1.98%
jan 1, 1998
53.845
-1.059
-1.93%
jan 1, 1999
53.923
+0.078
0.15%
jan 1, 2000
53.743
-0.18
-0.33%
jan 1, 2001
53.356
-0.387
-0.72%
jan 1, 2002
54.867
+1.511
2.83%
jan 1, 2003
55.783
+0.916
1.67%
jan 1, 2004
55.776
-0.007
-0.01%
jan 1, 2005
56.015
+0.239
0.43%
jan 1, 2006
55.718
-0.297
-0.53%
jan 1, 2007
55.802
+0.085
0.15%
jan 1, 2008
57.184
+1.382
2.48%
jan 1, 2009
58.0
+0.816
1.43%
jan 1, 2010
56.628
-1.372
-2.36%
jan 1, 2011
56.758
+0.129
0.23%
jan 1, 2012
56.701
-0.057
-0.1%
jan 1, 2013
55.901
-0.799
-1.41%
jan 1, 2014
55.261
-0.64
-1.14%
jan 1, 2015
55.528
+0.266
0.48%
jan 1, 2016
54.695
-0.833
-1.5%
Ranking of countries by current statistics by years


Comments: