29
/
en
AIzaSyAYiBZKx7MnpbEhh9jyipgxe19OcubqV5w
April 1, 2024
265851
Tonga
TON
true
2
1
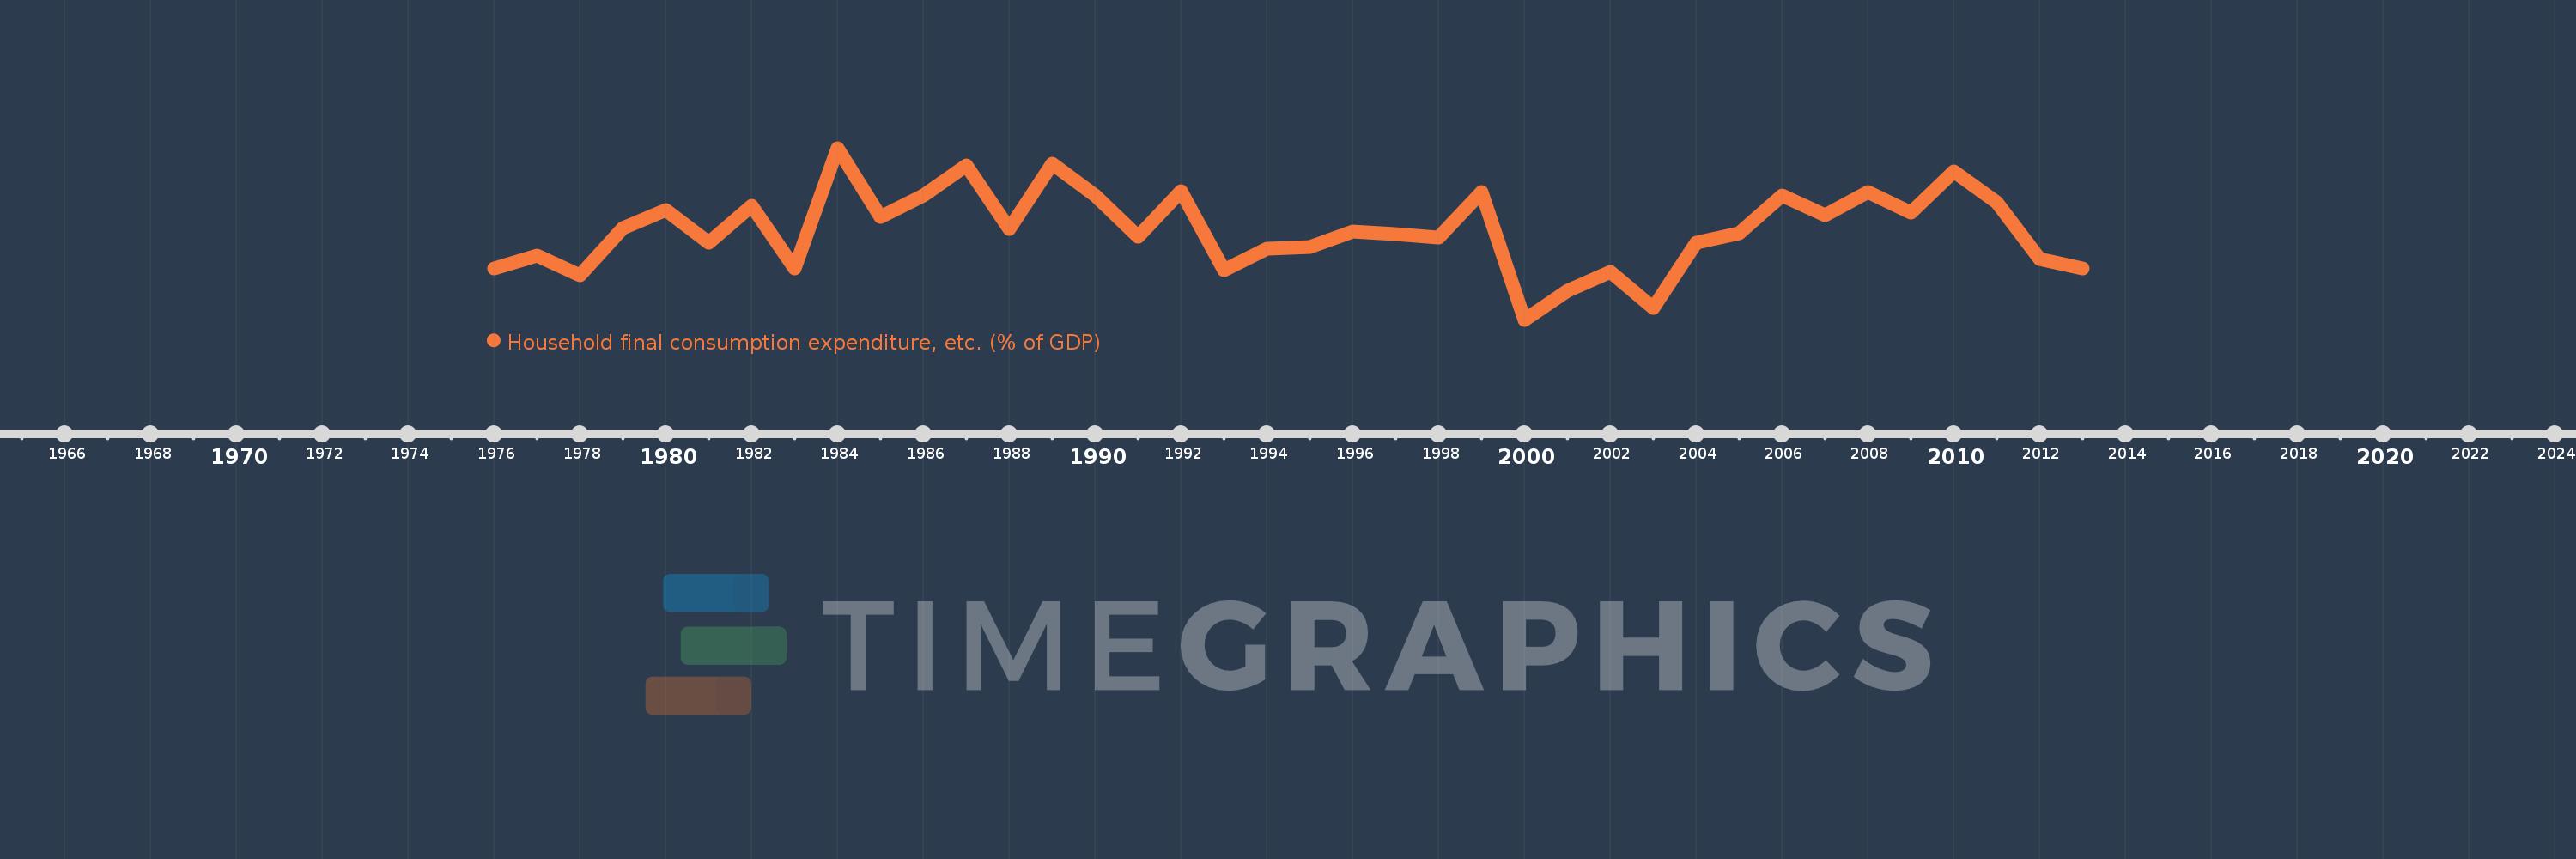
Household final consumption expenditure, etc. (% of GDP)
2013,2012,2011,2010,2009,2008,2007,2006,2005,2004,2003,2002,2001,2000,1999,1998,1997,1996,1995,1994,1993,1992,1991,1990,1989,1988,1987,1986,1985,1984,1983,1982,1981,1980,1979,1978,1977,1976
This statistics in other country:
AfghanistanAlbaniaAlgeriaAngolaAntigua and BarbudaArab WorldArgentinaArmeniaArubaAustraliaAustriaAzerbaijanBahamas, TheBahrainBangladeshBarbadosBelarusBelgiumBelizeBeninBermudaBhutanBoliviaBosnia and HerzegovinaBotswanaBrazilBrunei DarussalamBulgariaBurkina FasoBurundiCabo VerdeCambodiaCameroonCanadaCaribbean small statesCentral African RepublicCentral Europe and the BalticsChadChileChinaColombiaComorosCongo, Dem. Rep.Congo, Rep.Costa RicaCote d'IvoireCroatiaCubaCyprusCzech RepublicDenmarkDjiboutiDominicaDominican RepublicEarly-demographic dividendEast Asia & PacificEast Asia & Pacific (excluding high income)East Asia & Pacific (IDA & IBRD countries)EcuadorEgypt, Arab Rep.El SalvadorEquatorial GuineaEritreaEstoniaEthiopiaEuro areaEurope & Central AsiaEurope & Central Asia (excluding high income)Europe & Central Asia (IDA & IBRD countries)European UnionFaroe IslandsFijiFinlandFragile and conflict affected situationsFranceGabonGambia, TheGeorgiaGermanyGhanaGreeceGrenadaGuatemalaGuineaGuinea-BissauGuyanaHaitiHeavily indebted poor countries (HIPC)High incomeHondurasHong Kong SAR, ChinaHungaryIBRD onlyIcelandIDA & IBRD totalIDA blendIDA onlyIDA totalIndiaIndonesiaIran, Islamic Rep.IraqIrelandIsraelItalyJamaicaJapanJordanKazakhstanKenyaKiribatiKorea, Rep.KosovoKuwaitKyrgyz RepublicLao PDRLate-demographic dividendLatin America & Caribbean Latin America & Caribbean (excluding high income)Latin America & the Caribbean (IDA & IBRD countries)LatviaLeast developed countries: UN classificationLebanonLesothoLiberiaLibyaLithuaniaLow & middle incomeLow incomeLower middle incomeLuxembourgMacao SAR, ChinaMacedonia, FYRMadagascarMalawiMalaysiaMaldivesMaliMaltaMauritaniaMauritiusMexicoMicronesia, Fed. Sts.Middle East & North AfricaMiddle East & North Africa (excluding high income)Middle East & North Africa (IDA & IBRD countries)Middle incomeMoldovaMongoliaMontenegroMoroccoMozambiqueNamibiaNepalNetherlandsNew CaledoniaNew ZealandNicaraguaNigerNigeriaNorth AmericaNorwayOECD membersOmanOther small statesPacific island small statesPakistanPanamaPapua New GuineaParaguayPeruPhilippinesPolandPortugalPost-demographic dividendPre-demographic dividendPuerto RicoQatarRomaniaRussian FederationRwandaSaudi ArabiaSenegalSerbiaSeychellesSierra LeoneSingaporeSlovak RepublicSloveniaSmall statesSolomon IslandsSomaliaSouth AfricaSouth AsiaSouth Asia (IDA & IBRD)South SudanSpainSri LankaSt. Kitts and NevisSt. LuciaSt. Vincent and the GrenadinesSub-Saharan Africa Sub-Saharan Africa (excluding high income)Sub-Saharan Africa (IDA & IBRD countries)SudanSurinameSwazilandSwedenSwitzerlandSyrian Arab RepublicTajikistanTanzaniaThailandTimor-LesteTogoTongaTrinidad and TobagoTunisiaTurkeyTurkmenistanUgandaUkraineUnited Arab EmiratesUnited KingdomUnited StatesUpper middle incomeUruguayUzbekistanVanuatuVenezuela, RBVietnamWest Bank and GazaWorldYemen, Rep.ZambiaZimbabwe Timeline:
This timeline shows a graph from 1976 to 2013 of Tonga. No data until 1975. Number of actual observations by date: 38.
Source name:
World Development Indicators
Source organization:
World Bank national accounts data, and OECD National Accounts data files.
Categories, topics:
Economy & Growth
Last updated:
apr 23, 2017
Indicators value changes by year
Minimum:
81.251
jan 1, 2000
Maximum:
106.867
jan 1, 1984
At the date of observation
Value
Absolute change
Change from previous value
jan 1, 1976
88.903
+88.903
0.0%
jan 1, 1977
90.858
+1.955
2.2%
jan 1, 1978
87.819
-3.038
-3.34%
jan 1, 1979
94.86
+7.04
8.02%
jan 1, 1980
97.638
+2.778
2.93%
jan 1, 1981
92.771
-4.866
-4.98%
jan 1, 1982
98.285
+5.513
5.94%
jan 1, 1983
88.912
-9.373
-9.54%
jan 1, 1984
106.867
+17.954
20.19%
jan 1, 1985
96.585
-10.281
-9.62%
jan 1, 1986
99.753
+3.168
3.28%
jan 1, 1987
104.245
+4.492
4.5%
jan 1, 1988
94.848
-9.397
-9.01%
jan 1, 1989
104.555
+9.706
10.23%
jan 1, 1990
99.845
-4.709
-4.5%
jan 1, 1991
93.601
-6.244
-6.25%
jan 1, 1992
100.484
+6.882
7.35%
jan 1, 1993
88.676
-11.808
-11.75%
jan 1, 1994
91.887
+3.211
3.62%
jan 1, 1995
92.091
+0.204
0.22%
jan 1, 1996
94.437
+2.347
2.55%
jan 1, 1997
94.023
-0.414
-0.44%
jan 1, 1998
93.532
-0.491
-0.52%
jan 1, 1999
100.305
+6.773
7.24%
jan 1, 2000
81.251
-19.054
-19.0%
jan 1, 2001
85.608
+4.356
5.36%
jan 1, 2002
88.33
+2.723
3.18%
jan 1, 2003
82.953
-5.378
-6.09%
jan 1, 2004
92.689
+9.737
11.74%
jan 1, 2005
94.103
+1.413
1.52%
jan 1, 2006
99.82
+5.717
6.08%
jan 1, 2007
96.882
-2.939
-2.94%
jan 1, 2008
100.262
+3.38
3.49%
jan 1, 2009
97.181
-3.081
-3.07%
jan 1, 2010
103.417
+6.236
6.42%
jan 1, 2011
98.798
-4.619
-4.47%
jan 1, 2012
90.347
-8.451
-8.55%
jan 1, 2013
88.907
-1.439
-1.59%
Ranking of countries by current statistics by years


Comments: