29
/
en
AIzaSyAYiBZKx7MnpbEhh9jyipgxe19OcubqV5w
April 1, 2024
66274
Algeria
DZA
true
2
1
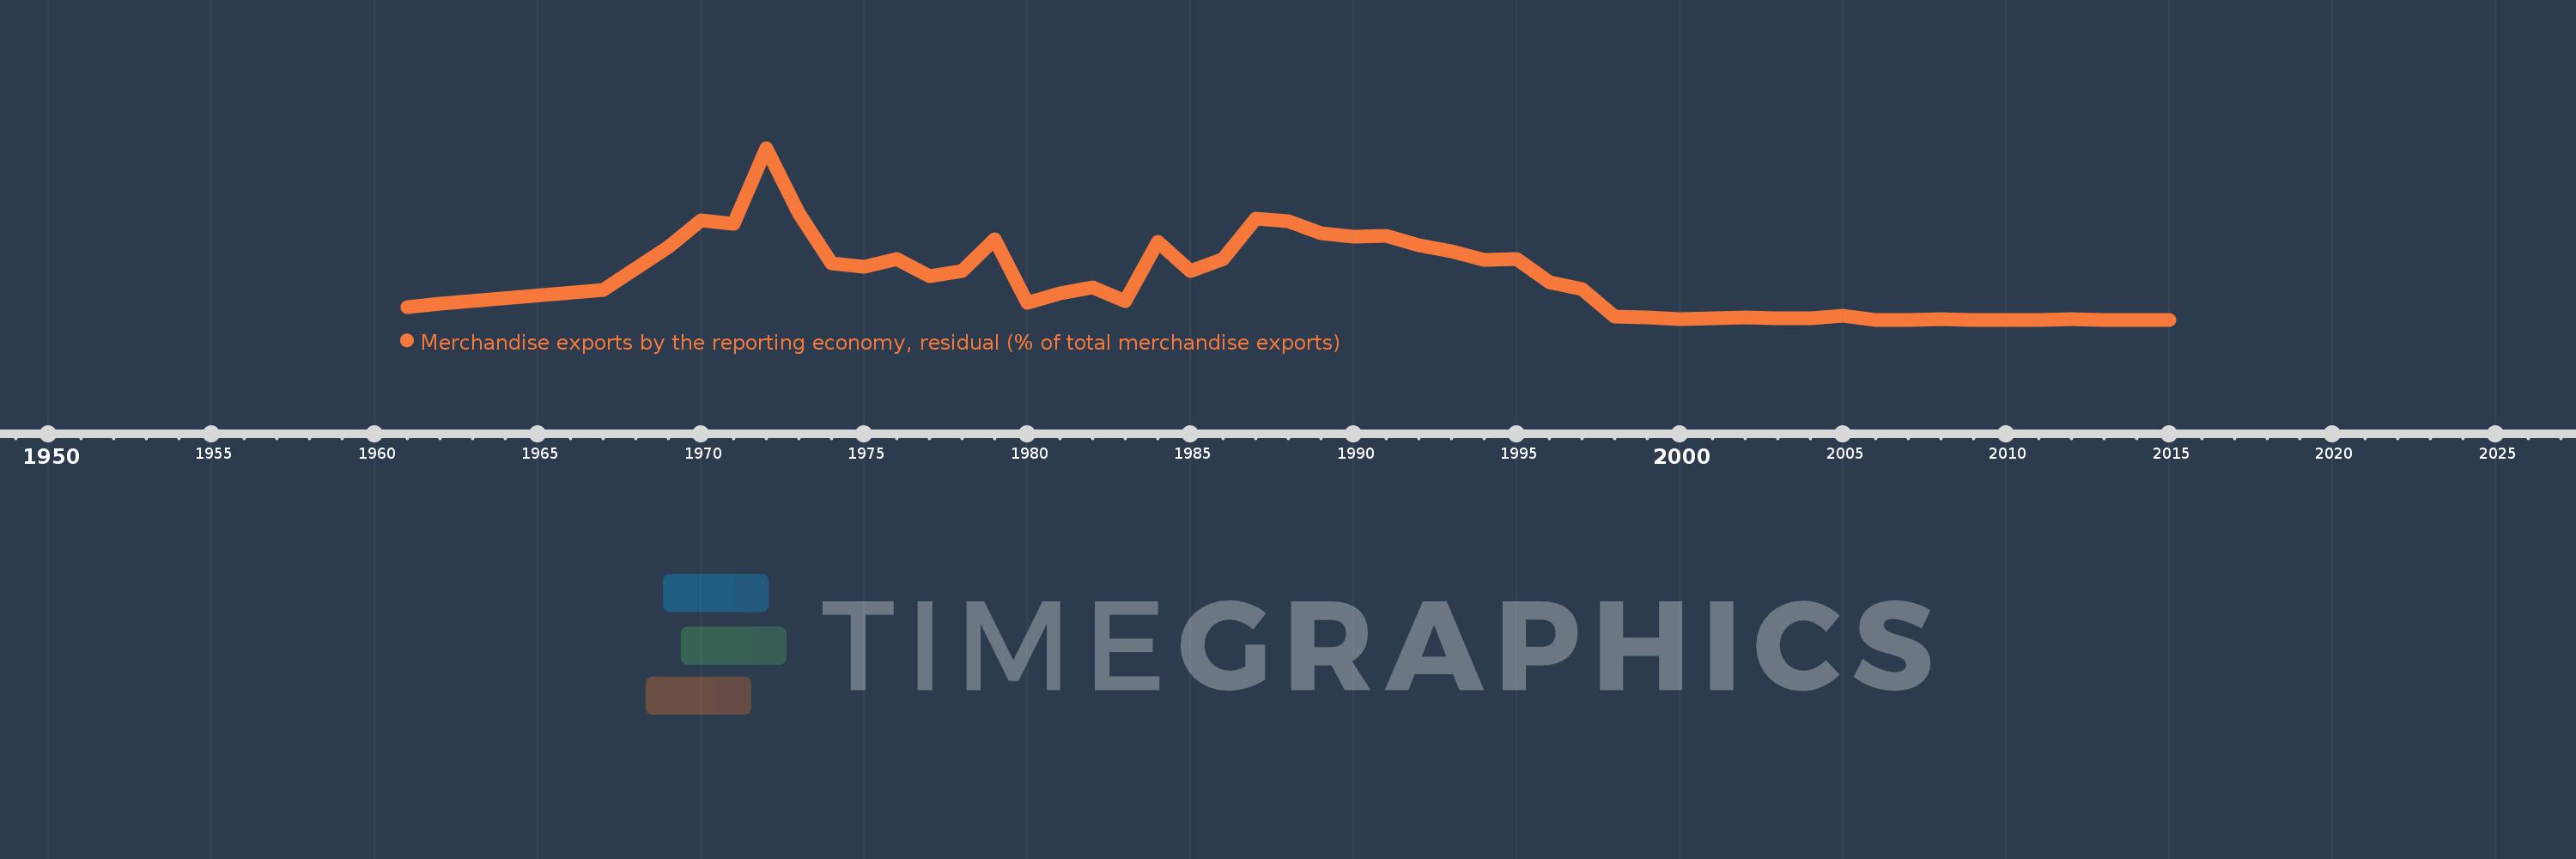
Merchandise exports by the reporting economy, residual (% of total merchandise exports)
2015,2014,2013,2012,2011,2010,2009,2008,2007,2006,2005,2004,2003,2002,2001,2000,1999,1998,1997,1996,1995,1994,1993,1992,1991,1990,1989,1988,1987,1986,1985,1984,1983,1982,1981,1980,1979,1978,1977,1976,1975,1974,1973,1972,1971,1970,1969,1968,1967,1962,1961
This statistics in other country:
AfghanistanAlbaniaAlgeriaAmerican SamoaAngolaAntigua and BarbudaArab WorldArgentinaArmeniaArubaAustraliaAustriaAzerbaijanBahamas, TheBahrainBangladeshBarbadosBelarusBelgiumBelizeBeninBermudaBoliviaBosnia and HerzegovinaBrazilBrunei DarussalamBulgariaBurkina FasoBurundiCabo VerdeCambodiaCameroonCanadaCaribbean small statesCentral African RepublicCentral Europe and the BalticsChadChileChinaColombiaComorosCongo, Dem. Rep.Congo, Rep.Costa RicaCote d'IvoireCroatiaCubaCyprusCzech RepublicDenmarkDjiboutiDominicaDominican RepublicEarly-demographic dividendEast Asia & PacificEast Asia & Pacific (excluding high income)East Asia & Pacific (IDA & IBRD countries)EcuadorEgypt, Arab Rep.El SalvadorEquatorial GuineaEstoniaEthiopiaEuro areaEurope & Central AsiaEurope & Central Asia (excluding high income)Europe & Central Asia (IDA & IBRD countries)European UnionFaroe IslandsFijiFinlandFragile and conflict affected situationsFranceFrench PolynesiaGabonGambia, TheGeorgiaGermanyGhanaGibraltarGreeceGreenlandGrenadaGuamGuatemalaGuineaGuinea-BissauGuyanaHaitiHeavily indebted poor countries (HIPC)High incomeHondurasHong Kong SAR, ChinaHungaryIBRD onlyIcelandIDA & IBRD totalIDA blendIDA onlyIDA totalIndiaIndonesiaIran, Islamic Rep.IraqIrelandIsraelItalyJamaicaJapanJordanKazakhstanKenyaKiribatiKorea, Dem. People’s Rep.Korea, Rep.KosovoKuwaitKyrgyz RepublicLao PDRLate-demographic dividendLatin America & Caribbean Latin America & Caribbean (excluding high income)Latin America & the Caribbean (IDA & IBRD countries)LatviaLeast developed countries: UN classificationLebanonLiberiaLibyaLithuaniaLow & middle incomeLow incomeLower middle incomeLuxembourgMacao SAR, ChinaMacedonia, FYRMadagascarMalawiMalaysiaMaldivesMaliMaltaMauritaniaMauritiusMexicoMiddle East & North AfricaMiddle East & North Africa (excluding high income)Middle East & North Africa (IDA & IBRD countries)Middle incomeMoldovaMongoliaMontenegroMoroccoMozambiqueMyanmarNauruNepalNetherlandsNew CaledoniaNew ZealandNicaraguaNigerNigeriaNorth AmericaNorwayOECD membersOmanOther small statesPacific island small statesPakistanPanamaPapua New GuineaParaguayPeruPhilippinesPolandPortugalPost-demographic dividendPre-demographic dividendQatarRomaniaRussian FederationRwandaSamoaSao Tome and PrincipeSaudi ArabiaSenegalSerbiaSeychellesSierra LeoneSingaporeSlovak RepublicSloveniaSmall statesSolomon IslandsSomaliaSouth AfricaSouth AsiaSouth Asia (IDA & IBRD)SpainSri LankaSt. Kitts and NevisSt. LuciaSt. Vincent and the GrenadinesSub-Saharan Africa Sub-Saharan Africa (excluding high income)Sub-Saharan Africa (IDA & IBRD countries)SudanSurinameSwedenSwitzerlandSyrian Arab RepublicTajikistanTanzaniaThailandTogoTongaTrinidad and TobagoTunisiaTurkeyTurkmenistanTuvaluUgandaUkraineUnited Arab EmiratesUnited KingdomUnited StatesUpper middle incomeUruguayUzbekistanVanuatuVenezuela, RBVietnamWorldYemen, Rep.ZambiaZimbabwe Timeline:
This timeline shows a graph from 1961 to 2015 of Algeria. No data until 1960. Number of actual observations by date: 51.
Source name:
World Development Indicators
Source organization:
World Bank staff estimates based data from International Monetary Fund's Direction of Trade database.
Categories, topics:
Private Sector, Trade
Last updated:
apr 23, 2017
Indicators value changes by year
Maximum:
18.256
jan 1, 1972
At the date of observation
Value
Absolute change
Change from previous value
jan 1, 1961
1.373
+1.373
0.0%
jan 1, 1962
1.7
+0.327
23.79%
jan 1, 1967
3.187
+1.487
87.49%
jan 1, 1968
5.434
+2.247
70.49%
jan 1, 1969
7.705
+2.271
41.79%
jan 1, 1970
10.573
+2.868
37.22%
jan 1, 1971
10.205
-0.368
-3.48%
jan 1, 1972
18.256
+8.052
78.9%
jan 1, 1973
11.265
-6.992
-38.3%
jan 1, 1974
6.025
-5.24
-46.51%
jan 1, 1975
5.626
-0.4
-6.63%
jan 1, 1976
6.44
+0.815
14.48%
jan 1, 1977
4.665
-1.775
-27.56%
jan 1, 1978
5.146
+0.481
10.31%
jan 1, 1979
8.578
+3.431
66.67%
jan 1, 1980
1.774
-6.804
-79.32%
jan 1, 1981
2.764
+0.99
55.79%
jan 1, 1982
3.452
+0.689
24.92%
jan 1, 1983
2.016
-1.436
-41.59%
jan 1, 1984
8.311
+6.294
312.16%
jan 1, 1985
5.178
-3.133
-37.69%
jan 1, 1986
6.424
+1.246
24.06%
jan 1, 1987
10.782
+4.358
67.84%
jan 1, 1988
10.499
-0.283
-2.62%
jan 1, 1989
9.236
-1.263
-12.03%
jan 1, 1990
8.832
-0.404
-4.37%
jan 1, 1991
8.955
+0.123
1.39%
jan 1, 1992
7.893
-1.062
-11.86%
jan 1, 1993
7.233
-0.66
-8.36%
jan 1, 1994
6.395
-0.837
-11.58%
jan 1, 1995
6.45
+0.055
0.86%
jan 1, 1996
4.019
-2.431
-37.69%
jan 1, 1997
3.244
-0.775
-19.28%
jan 1, 1998
0.346
-2.898
-89.32%
jan 1, 1999
0.201
-0.145
-41.99%
jan 1, 2000
0.067
-0.134
-66.83%
jan 1, 2001
0.165
+0.098
147.27%
jan 1, 2002
0.211
+0.047
28.32%
jan 1, 2003
0.141
-0.071
-33.34%
jan 1, 2004
0.129
-0.012
-8.51%
jan 1, 2005
0.42
+0.291
225.61%
jan 1, 2006
0.002
-0.418
-99.43%
jan 1, 2007
0.0
-0.002
-100.0%
jan 1, 2008
0.093
+0.093
1.27 trl%
jan 1, 2009
0.0
-0.093
-99.87%
jan 1, 2010
0.0
0.0
-100.0%
jan 1, 2011
0.001
+0.001
6.82 trl%
jan 1, 2012
0.06
+0.059
8.2K%
jan 1, 2013
0.0
-0.06
-100.0%
jan 1, 2014
0.001
+0.001
-37.17 bln%
jan 1, 2015
0.0
0.0
-97.25%
Ranking of countries by current statistics by years


Comments: