29
/
en
AIzaSyAYiBZKx7MnpbEhh9jyipgxe19OcubqV5w
April 1, 2024
34376
Fragile and conflict affected situations
FCS
false
2
1
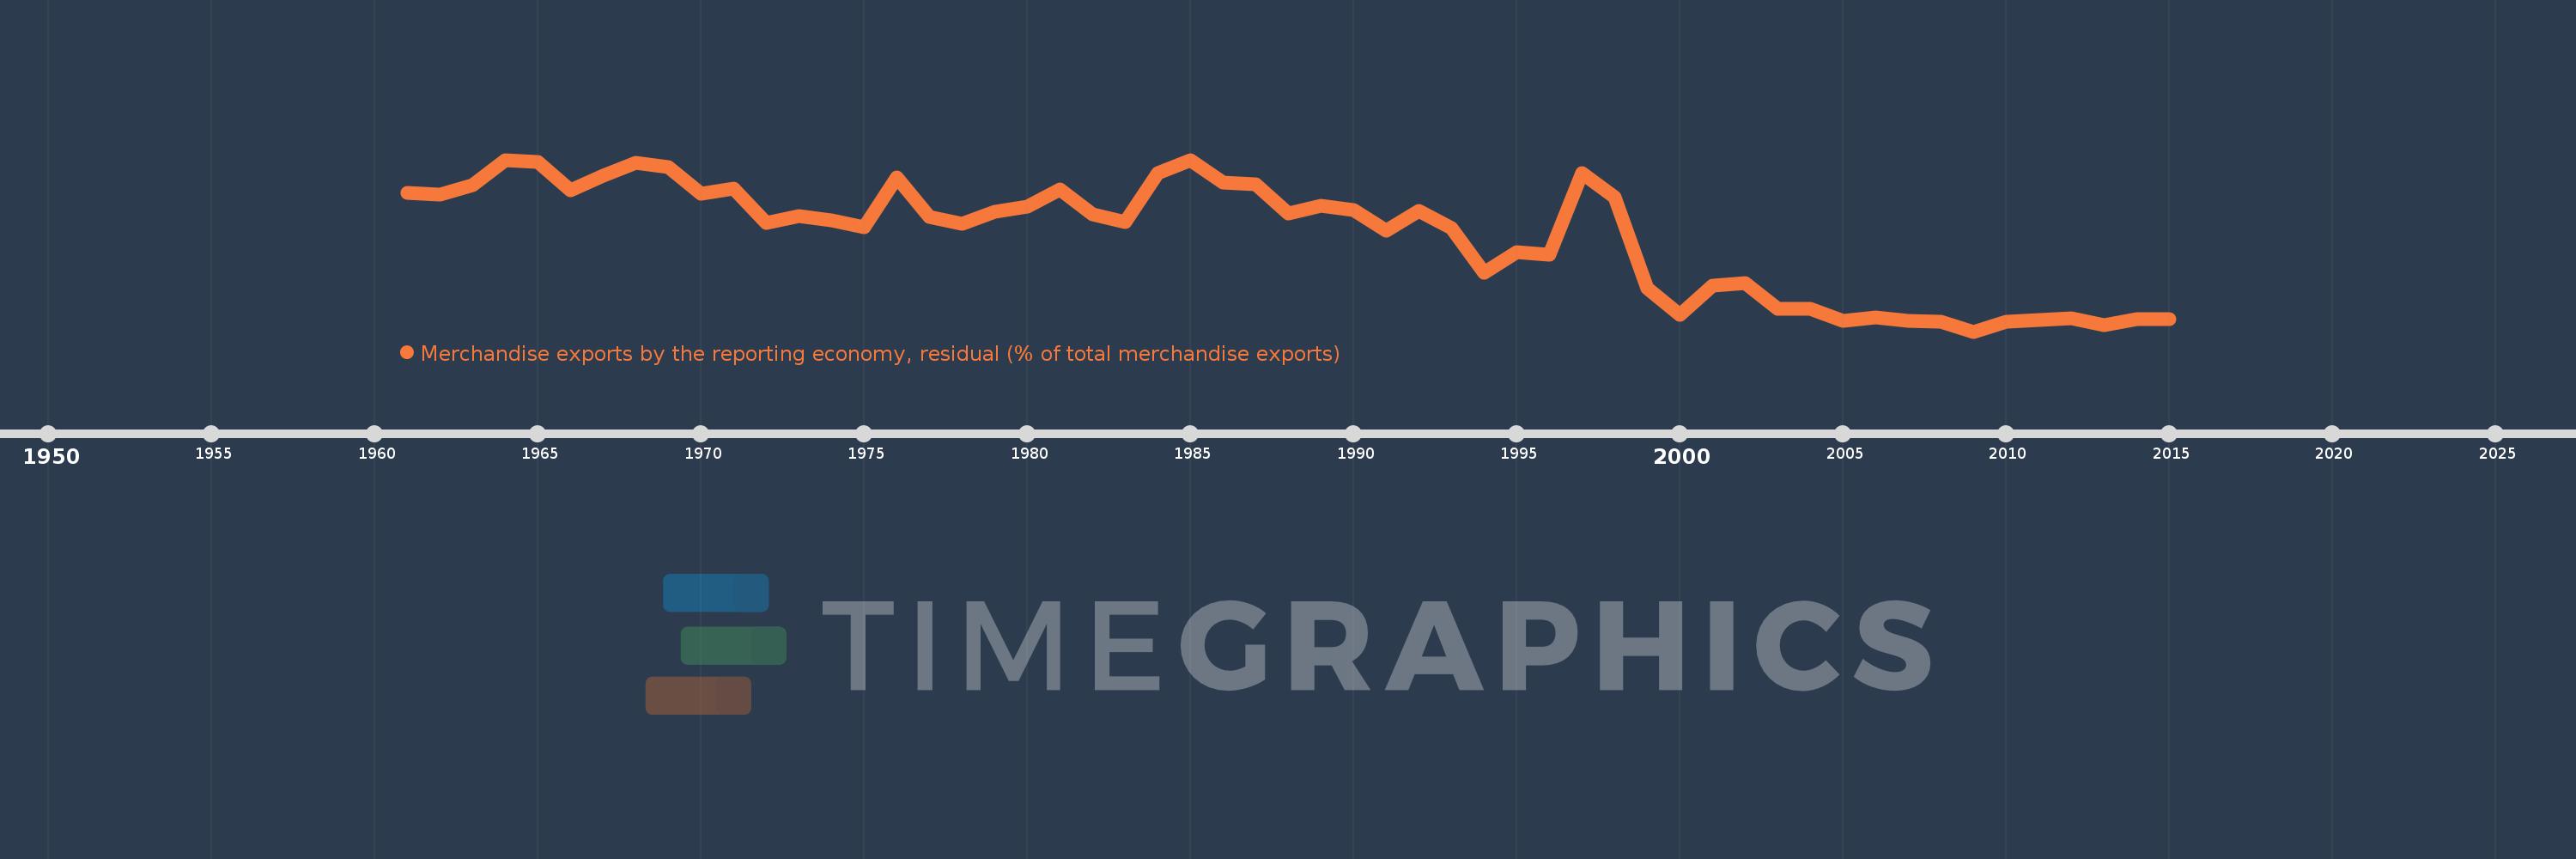
Merchandise exports by the reporting economy, residual (% of total merchandise exports)
2015,2014,2013,2012,2011,2010,2009,2008,2007,2006,2005,2004,2003,2002,2001,2000,1999,1998,1997,1996,1995,1994,1993,1992,1991,1990,1989,1988,1987,1986,1985,1984,1983,1982,1981,1980,1979,1978,1977,1976,1975,1974,1973,1972,1971,1970,1969,1968,1967,1966,1965,1964,1963,1962,1961
This statistics in other country:
AfghanistanAlbaniaAlgeriaAmerican SamoaAngolaAntigua and BarbudaArab WorldArgentinaArmeniaArubaAustraliaAustriaAzerbaijanBahamas, TheBahrainBangladeshBarbadosBelarusBelgiumBelizeBeninBermudaBoliviaBosnia and HerzegovinaBrazilBrunei DarussalamBulgariaBurkina FasoBurundiCabo VerdeCambodiaCameroonCanadaCaribbean small statesCentral African RepublicCentral Europe and the BalticsChadChileChinaColombiaComorosCongo, Dem. Rep.Congo, Rep.Costa RicaCote d'IvoireCroatiaCubaCyprusCzech RepublicDenmarkDjiboutiDominicaDominican RepublicEarly-demographic dividendEast Asia & PacificEast Asia & Pacific (excluding high income)East Asia & Pacific (IDA & IBRD countries)EcuadorEgypt, Arab Rep.El SalvadorEquatorial GuineaEstoniaEthiopiaEuro areaEurope & Central AsiaEurope & Central Asia (excluding high income)Europe & Central Asia (IDA & IBRD countries)European UnionFaroe IslandsFijiFinlandFragile and conflict affected situationsFranceFrench PolynesiaGabonGambia, TheGeorgiaGermanyGhanaGibraltarGreeceGreenlandGrenadaGuamGuatemalaGuineaGuinea-BissauGuyanaHaitiHeavily indebted poor countries (HIPC)High incomeHondurasHong Kong SAR, ChinaHungaryIBRD onlyIcelandIDA & IBRD totalIDA blendIDA onlyIDA totalIndiaIndonesiaIran, Islamic Rep.IraqIrelandIsraelItalyJamaicaJapanJordanKazakhstanKenyaKiribatiKorea, Dem. People’s Rep.Korea, Rep.KosovoKuwaitKyrgyz RepublicLao PDRLate-demographic dividendLatin America & Caribbean Latin America & Caribbean (excluding high income)Latin America & the Caribbean (IDA & IBRD countries)LatviaLeast developed countries: UN classificationLebanonLiberiaLibyaLithuaniaLow & middle incomeLow incomeLower middle incomeLuxembourgMacao SAR, ChinaMacedonia, FYRMadagascarMalawiMalaysiaMaldivesMaliMaltaMauritaniaMauritiusMexicoMiddle East & North AfricaMiddle East & North Africa (excluding high income)Middle East & North Africa (IDA & IBRD countries)Middle incomeMoldovaMongoliaMontenegroMoroccoMozambiqueMyanmarNauruNepalNetherlandsNew CaledoniaNew ZealandNicaraguaNigerNigeriaNorth AmericaNorwayOECD membersOmanOther small statesPacific island small statesPakistanPanamaPapua New GuineaParaguayPeruPhilippinesPolandPortugalPost-demographic dividendPre-demographic dividendQatarRomaniaRussian FederationRwandaSamoaSao Tome and PrincipeSaudi ArabiaSenegalSerbiaSeychellesSierra LeoneSingaporeSlovak RepublicSloveniaSmall statesSolomon IslandsSomaliaSouth AfricaSouth AsiaSouth Asia (IDA & IBRD)SpainSri LankaSt. Kitts and NevisSt. LuciaSt. Vincent and the GrenadinesSub-Saharan Africa Sub-Saharan Africa (excluding high income)Sub-Saharan Africa (IDA & IBRD countries)SudanSurinameSwedenSwitzerlandSyrian Arab RepublicTajikistanTanzaniaThailandTogoTongaTrinidad and TobagoTunisiaTurkeyTurkmenistanTuvaluUgandaUkraineUnited Arab EmiratesUnited KingdomUnited StatesUpper middle incomeUruguayUzbekistanVanuatuVenezuela, RBVietnamWorldYemen, Rep.ZambiaZimbabwe Timeline:
This timeline shows a graph from 1961 to 2015 of Fragile and conflict affected situations. No data until 1960. Number of actual observations by date: 55.
Source name:
World Development Indicators
Source organization:
World Bank staff estimates based data from International Monetary Fund's Direction of Trade database.
Categories, topics:
Private Sector, Trade
Last updated:
apr 23, 2017
Indicators value changes by year
Maximum:
18.846
jan 1, 1985
At the date of observation
Value
Absolute change
Change from previous value
jan 1, 1961
15.691
+15.691
0.0%
jan 1, 1962
15.496
-0.195
-1.24%
jan 1, 1963
16.438
+0.942
6.08%
jan 1, 1964
18.777
+2.338
14.22%
jan 1, 1965
18.67
-0.107
-0.57%
jan 1, 1966
15.892
-2.777
-14.88%
jan 1, 1967
17.338
+1.446
9.1%
jan 1, 1968
18.579
+1.241
7.16%
jan 1, 1969
18.129
-0.45
-2.42%
jan 1, 1970
15.555
-2.573
-14.2%
jan 1, 1971
16.084
+0.528
3.4%
jan 1, 1972
12.809
-3.275
-20.36%
jan 1, 1973
13.468
+0.66
5.15%
jan 1, 1974
13.05
-0.419
-3.11%
jan 1, 1975
12.354
-0.695
-5.33%
jan 1, 1976
17.135
+4.781
38.7%
jan 1, 1977
13.395
-3.741
-21.83%
jan 1, 1978
12.742
-0.652
-4.87%
jan 1, 1979
13.861
+1.119
8.78%
jan 1, 1980
14.33
+0.469
3.38%
jan 1, 1981
16.014
+1.684
11.75%
jan 1, 1982
13.645
-2.37
-14.8%
jan 1, 1983
12.874
-0.771
-5.65%
jan 1, 1984
17.55
+4.676
36.32%
jan 1, 1985
18.846
+1.296
7.38%
jan 1, 1986
16.696
-2.15
-11.41%
jan 1, 1987
16.532
-0.164
-0.98%
jan 1, 1988
13.666
-2.866
-17.34%
jan 1, 1989
14.429
+0.764
5.59%
jan 1, 1990
13.999
-0.431
-2.98%
jan 1, 1991
12.017
-1.982
-14.16%
jan 1, 1992
13.968
+1.951
16.24%
jan 1, 1993
12.289
-1.679
-12.02%
jan 1, 1994
8.01
-4.279
-34.82%
jan 1, 1995
9.965
+1.955
24.4%
jan 1, 1996
9.756
-0.208
-2.09%
jan 1, 1997
17.581
+7.825
80.2%
jan 1, 1998
15.3
-2.281
-12.97%
jan 1, 1999
6.495
-8.805
-57.55%
jan 1, 2000
3.947
-2.549
-39.24%
jan 1, 2001
6.8
+2.854
72.3%
jan 1, 2002
6.989
+0.188
2.77%
jan 1, 2003
4.553
-2.436
-34.85%
jan 1, 2004
4.562
+0.009
0.21%
jan 1, 2005
3.406
-1.156
-25.35%
jan 1, 2006
3.689
+0.283
8.31%
jan 1, 2007
3.42
-0.269
-7.3%
jan 1, 2008
3.295
-0.125
-3.64%
jan 1, 2009
2.368
-0.927
-28.13%
jan 1, 2010
3.339
+0.97
40.97%
jan 1, 2011
3.508
+0.169
5.07%
jan 1, 2012
3.66
+0.152
4.33%
jan 1, 2013
2.989
-0.671
-18.33%
jan 1, 2014
3.545
+0.557
18.62%
jan 1, 2015
3.555
+0.01
0.28%
Ranking of countries by current statistics by years


Comments: