29
/
en
AIzaSyAYiBZKx7MnpbEhh9jyipgxe19OcubqV5w
April 1, 2024
238470
Seychelles
SYC
true
2
1
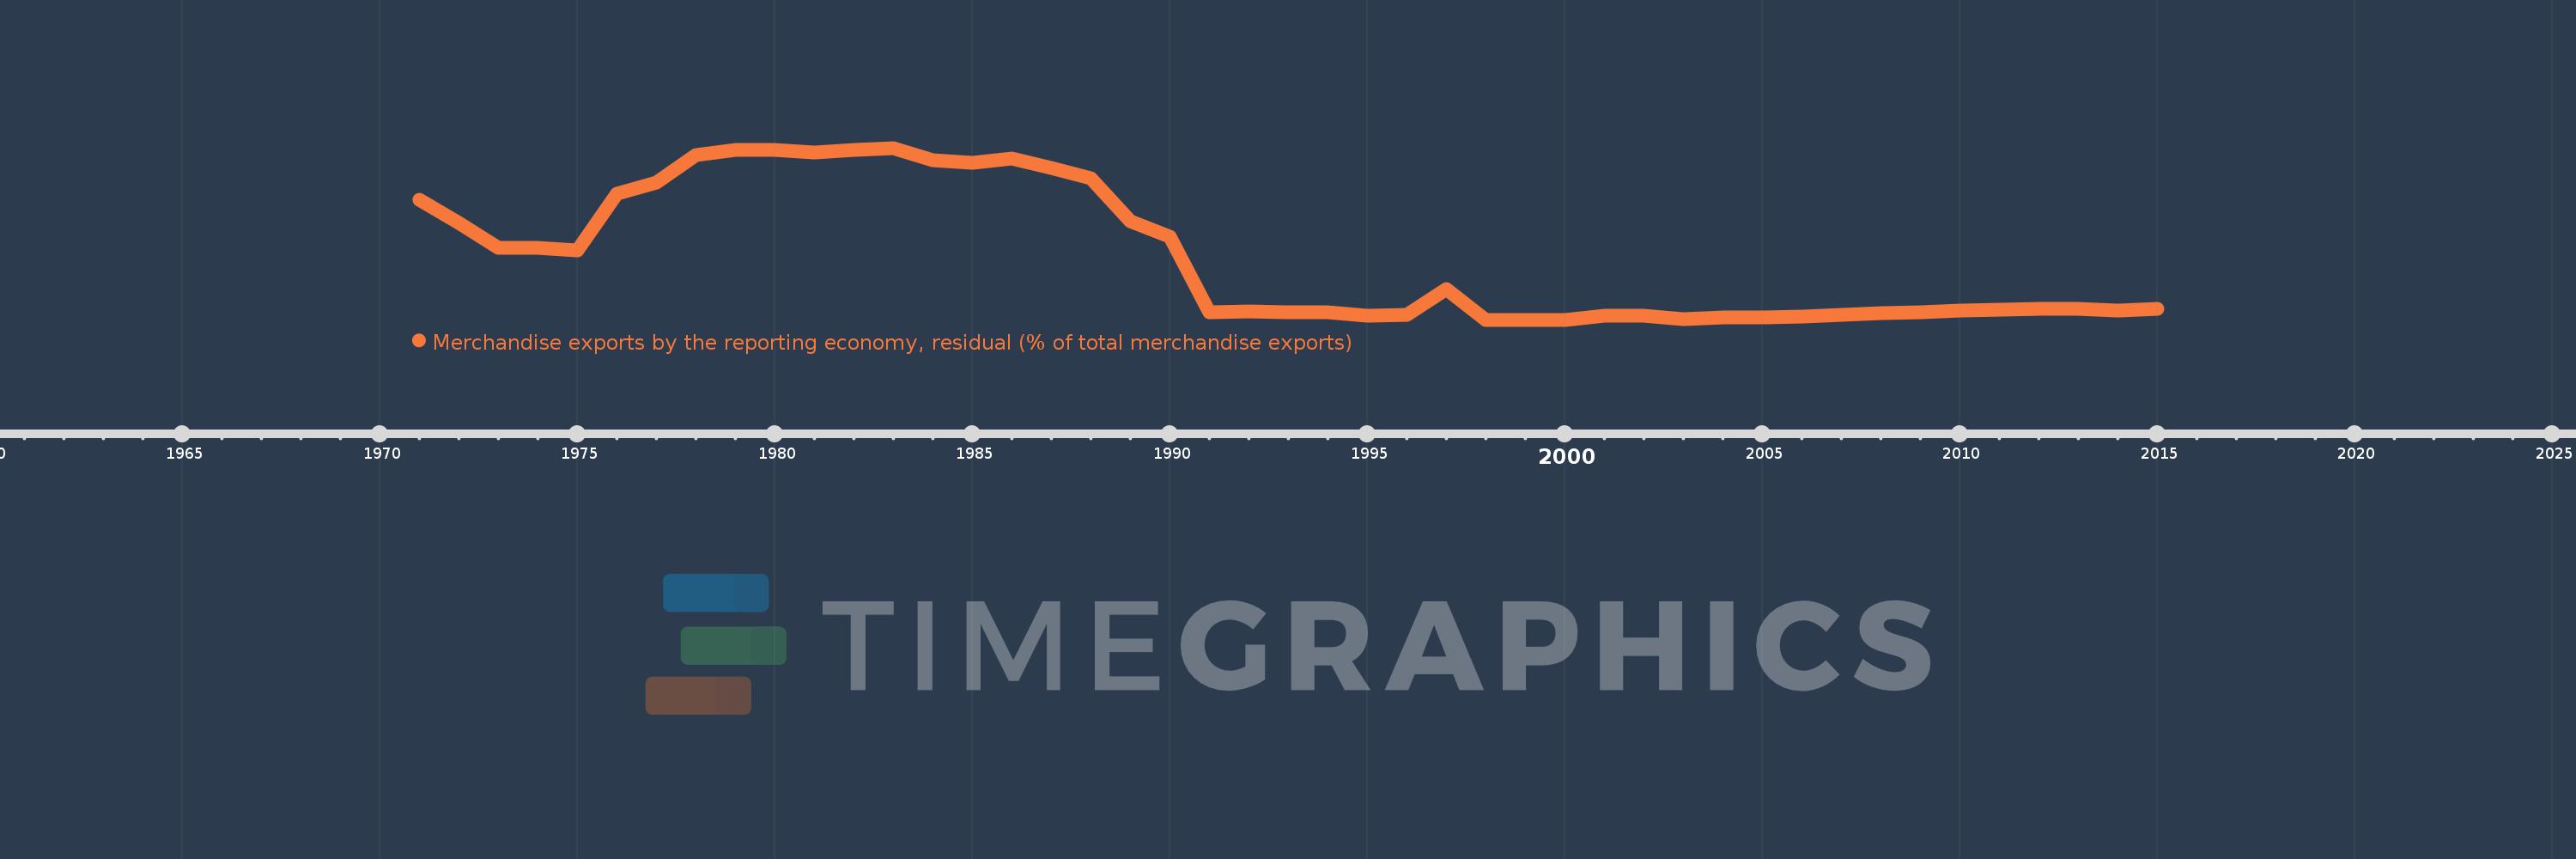
Merchandise exports by the reporting economy, residual (% of total merchandise exports)
2015,2014,2013,2012,2011,2010,2009,2008,2007,2006,2005,2004,2003,2002,2001,2000,1999,1998,1997,1996,1995,1994,1993,1992,1991,1990,1989,1988,1987,1986,1985,1984,1983,1982,1981,1980,1979,1978,1977,1976,1975,1974,1973,1972,1971
This statistics in other country:
AfghanistanAlbaniaAlgeriaAmerican SamoaAngolaAntigua and BarbudaArab WorldArgentinaArmeniaArubaAustraliaAustriaAzerbaijanBahamas, TheBahrainBangladeshBarbadosBelarusBelgiumBelizeBeninBermudaBoliviaBosnia and HerzegovinaBrazilBrunei DarussalamBulgariaBurkina FasoBurundiCabo VerdeCambodiaCameroonCanadaCaribbean small statesCentral African RepublicCentral Europe and the BalticsChadChileChinaColombiaComorosCongo, Dem. Rep.Congo, Rep.Costa RicaCote d'IvoireCroatiaCubaCyprusCzech RepublicDenmarkDjiboutiDominicaDominican RepublicEarly-demographic dividendEast Asia & PacificEast Asia & Pacific (excluding high income)East Asia & Pacific (IDA & IBRD countries)EcuadorEgypt, Arab Rep.El SalvadorEquatorial GuineaEstoniaEthiopiaEuro areaEurope & Central AsiaEurope & Central Asia (excluding high income)Europe & Central Asia (IDA & IBRD countries)European UnionFaroe IslandsFijiFinlandFragile and conflict affected situationsFranceFrench PolynesiaGabonGambia, TheGeorgiaGermanyGhanaGibraltarGreeceGreenlandGrenadaGuamGuatemalaGuineaGuinea-BissauGuyanaHaitiHeavily indebted poor countries (HIPC)High incomeHondurasHong Kong SAR, ChinaHungaryIBRD onlyIcelandIDA & IBRD totalIDA blendIDA onlyIDA totalIndiaIndonesiaIran, Islamic Rep.IraqIrelandIsraelItalyJamaicaJapanJordanKazakhstanKenyaKiribatiKorea, Dem. People’s Rep.Korea, Rep.KosovoKuwaitKyrgyz RepublicLao PDRLate-demographic dividendLatin America & Caribbean Latin America & Caribbean (excluding high income)Latin America & the Caribbean (IDA & IBRD countries)LatviaLeast developed countries: UN classificationLebanonLiberiaLibyaLithuaniaLow & middle incomeLow incomeLower middle incomeLuxembourgMacao SAR, ChinaMacedonia, FYRMadagascarMalawiMalaysiaMaldivesMaliMaltaMauritaniaMauritiusMexicoMiddle East & North AfricaMiddle East & North Africa (excluding high income)Middle East & North Africa (IDA & IBRD countries)Middle incomeMoldovaMongoliaMontenegroMoroccoMozambiqueMyanmarNauruNepalNetherlandsNew CaledoniaNew ZealandNicaraguaNigerNigeriaNorth AmericaNorwayOECD membersOmanOther small statesPacific island small statesPakistanPanamaPapua New GuineaParaguayPeruPhilippinesPolandPortugalPost-demographic dividendPre-demographic dividendQatarRomaniaRussian FederationRwandaSamoaSao Tome and PrincipeSaudi ArabiaSenegalSerbiaSeychellesSierra LeoneSingaporeSlovak RepublicSloveniaSmall statesSolomon IslandsSomaliaSouth AfricaSouth AsiaSouth Asia (IDA & IBRD)SpainSri LankaSt. Kitts and NevisSt. LuciaSt. Vincent and the GrenadinesSub-Saharan Africa Sub-Saharan Africa (excluding high income)Sub-Saharan Africa (IDA & IBRD countries)SudanSurinameSwedenSwitzerlandSyrian Arab RepublicTajikistanTanzaniaThailandTogoTongaTrinidad and TobagoTunisiaTurkeyTurkmenistanTuvaluUgandaUkraineUnited Arab EmiratesUnited KingdomUnited StatesUpper middle incomeUruguayUzbekistanVanuatuVenezuela, RBVietnamWorldYemen, Rep.ZambiaZimbabwe Timeline:
This timeline shows a graph from 1971 to 2015 of Seychelles. No data until 1970. Number of actual observations by date: 45.
Source name:
World Development Indicators
Source organization:
World Bank staff estimates based data from International Monetary Fund's Direction of Trade database.
Categories, topics:
Private Sector, Trade
Last updated:
apr 23, 2017
Indicators value changes by year
Maximum:
95.714
jan 1, 1983
At the date of observation
Value
Absolute change
Change from previous value
jan 1, 1971
66.667
+66.667
0.0%
jan 1, 1972
53.846
-12.821
-19.23%
jan 1, 1973
40.0
-13.846
-25.71%
jan 1, 1975
38.462
-1.538
-3.85%
jan 1, 1976
70.0
+31.538
82.0%
jan 1, 1977
76.471
+6.471
9.24%
jan 1, 1978
91.667
+15.196
19.87%
jan 1, 1979
94.574
+2.907
3.17%
jan 1, 1980
94.643
+0.069
0.07%
jan 1, 1981
93.082
-1.561
-1.65%
jan 1, 1982
94.643
+1.561
1.68%
jan 1, 1983
95.714
+1.071
1.13%
jan 1, 1984
89.063
-6.652
-6.95%
jan 1, 1985
87.302
-1.761
-1.98%
jan 1, 1986
89.744
+2.442
2.8%
jan 1, 1987
84.746
-4.998
-5.57%
jan 1, 1988
78.641
-6.105
-7.2%
jan 1, 1989
54.949
-23.692
-30.13%
jan 1, 1990
46.238
-8.711
-15.85%
jan 1, 1991
3.984
-42.255
-91.38%
jan 1, 1992
4.702
+0.718
18.03%
jan 1, 1993
4.197
-0.505
-10.75%
jan 1, 1994
4.296
+0.099
2.37%
jan 1, 1995
2.49
-1.806
-42.04%
jan 1, 1996
2.563
+0.074
2.96%
jan 1, 1997
17.018
+14.455
563.89%
jan 1, 1998
0.058
-16.96
-99.66%
jan 1, 1999
0.021
-0.037
-63.82%
jan 1, 2000
0.017
-0.004
-17.71%
jan 1, 2001
2.462
+2.445
14.12K%
jan 1, 2002
2.374
-0.088
-3.58%
jan 1, 2003
0.365
-2.009
-84.61%
jan 1, 2004
1.298
+0.933
255.38%
jan 1, 2005
1.433
+0.135
10.4%
jan 1, 2006
1.847
+0.414
28.88%
jan 1, 2007
2.867
+1.02
55.22%
jan 1, 2008
3.77
+0.902
31.46%
jan 1, 2009
4.141
+0.371
9.84%
jan 1, 2010
5.37
+1.23
29.7%
jan 1, 2011
5.717
+0.347
6.46%
jan 1, 2012
6.315
+0.597
10.45%
jan 1, 2013
5.986
-0.329
-5.21%
jan 1, 2014
5.189
-0.797
-13.31%
jan 1, 2015
5.941
+0.751
14.48%
Ranking of countries by current statistics by years


Comments: