29
/
en
AIzaSyAYiBZKx7MnpbEhh9jyipgxe19OcubqV5w
April 1, 2024
189239
Maldives
MDV
true
2
1
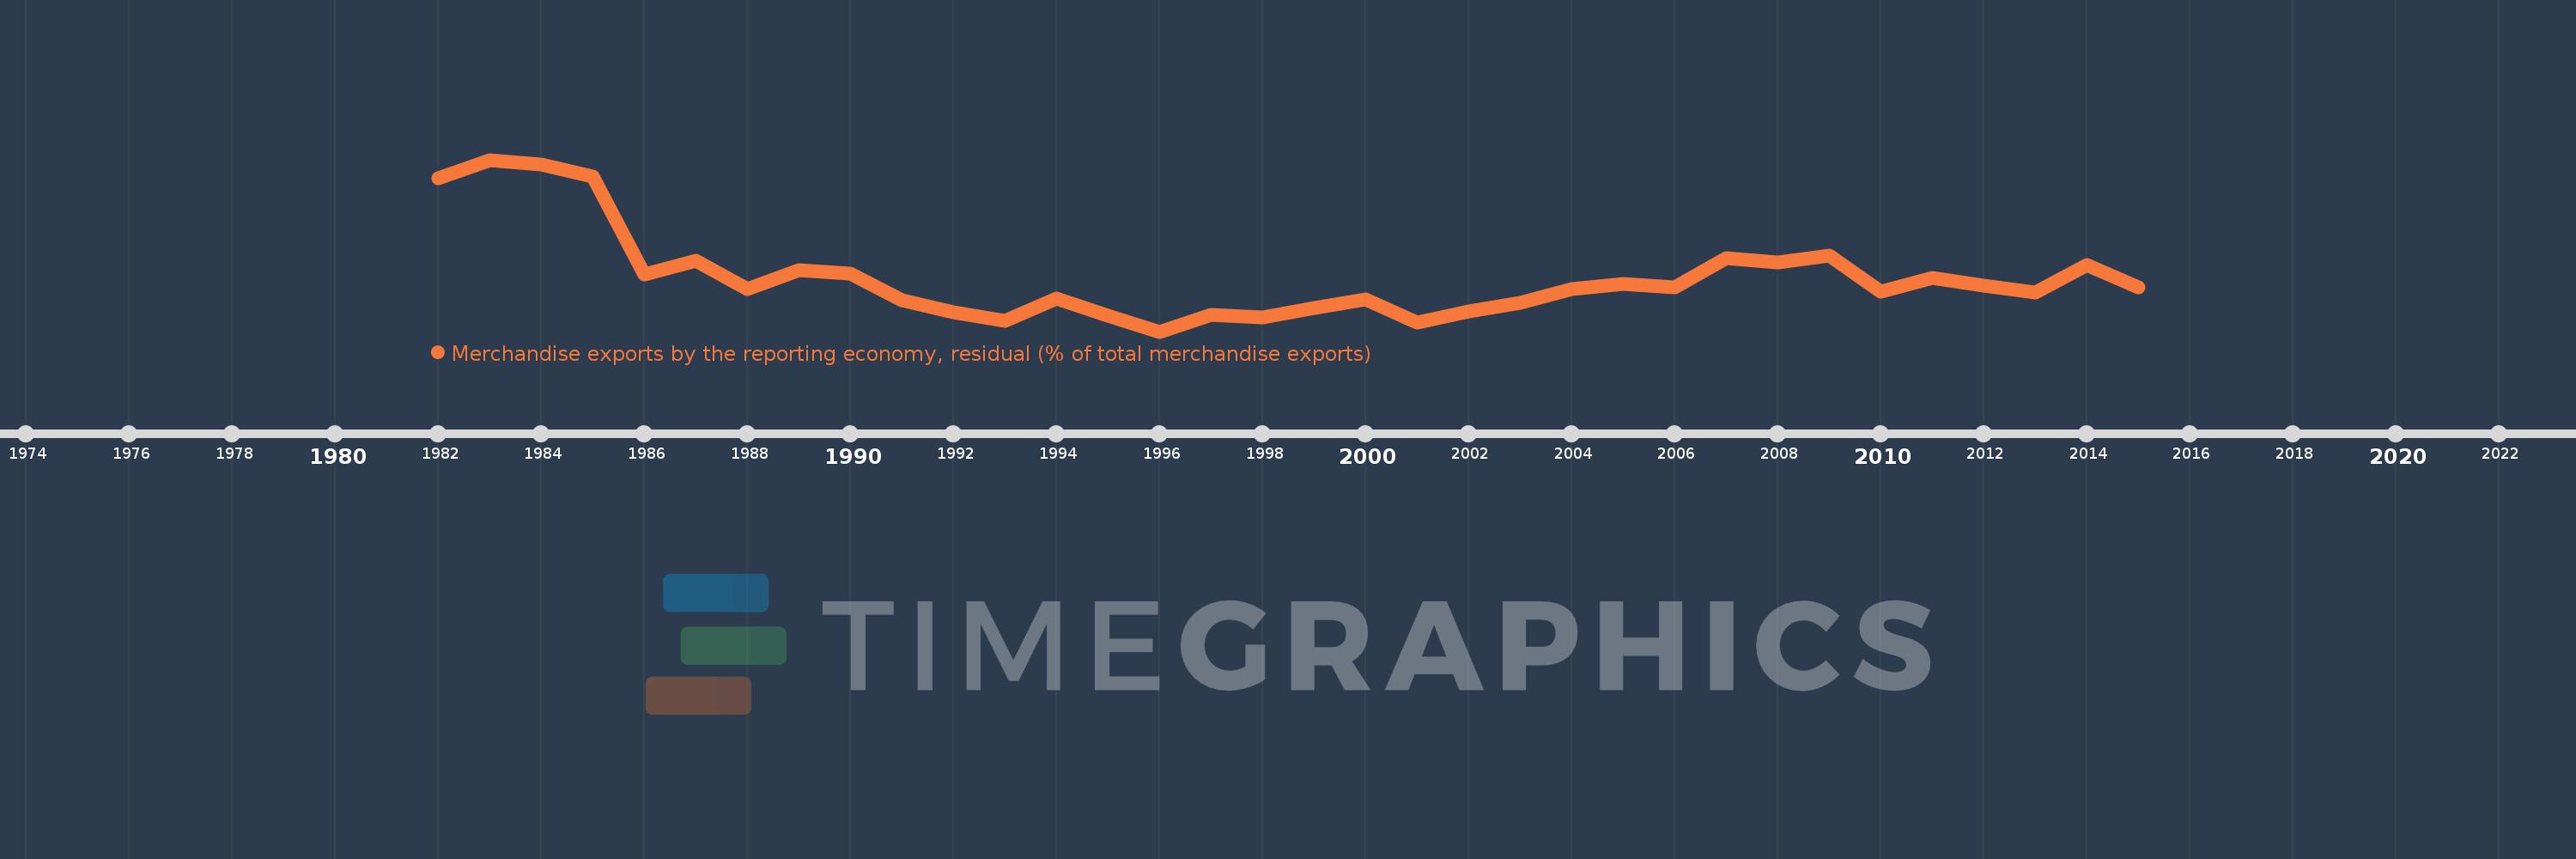
Merchandise exports by the reporting economy, residual (% of total merchandise exports)
2015,2014,2013,2012,2011,2010,2009,2008,2007,2006,2005,2004,2003,2002,2001,2000,1999,1998,1997,1996,1995,1994,1993,1992,1991,1990,1989,1988,1987,1986,1985,1984,1983,1982
This statistics in other country:
AfghanistanAlbaniaAlgeriaAmerican SamoaAngolaAntigua and BarbudaArab WorldArgentinaArmeniaArubaAustraliaAustriaAzerbaijanBahamas, TheBahrainBangladeshBarbadosBelarusBelgiumBelizeBeninBermudaBoliviaBosnia and HerzegovinaBrazilBrunei DarussalamBulgariaBurkina FasoBurundiCabo VerdeCambodiaCameroonCanadaCaribbean small statesCentral African RepublicCentral Europe and the BalticsChadChileChinaColombiaComorosCongo, Dem. Rep.Congo, Rep.Costa RicaCote d'IvoireCroatiaCubaCyprusCzech RepublicDenmarkDjiboutiDominicaDominican RepublicEarly-demographic dividendEast Asia & PacificEast Asia & Pacific (excluding high income)East Asia & Pacific (IDA & IBRD countries)EcuadorEgypt, Arab Rep.El SalvadorEquatorial GuineaEstoniaEthiopiaEuro areaEurope & Central AsiaEurope & Central Asia (excluding high income)Europe & Central Asia (IDA & IBRD countries)European UnionFaroe IslandsFijiFinlandFragile and conflict affected situationsFranceFrench PolynesiaGabonGambia, TheGeorgiaGermanyGhanaGibraltarGreeceGreenlandGrenadaGuamGuatemalaGuineaGuinea-BissauGuyanaHaitiHeavily indebted poor countries (HIPC)High incomeHondurasHong Kong SAR, ChinaHungaryIBRD onlyIcelandIDA & IBRD totalIDA blendIDA onlyIDA totalIndiaIndonesiaIran, Islamic Rep.IraqIrelandIsraelItalyJamaicaJapanJordanKazakhstanKenyaKiribatiKorea, Dem. People’s Rep.Korea, Rep.KosovoKuwaitKyrgyz RepublicLao PDRLate-demographic dividendLatin America & Caribbean Latin America & Caribbean (excluding high income)Latin America & the Caribbean (IDA & IBRD countries)LatviaLeast developed countries: UN classificationLebanonLiberiaLibyaLithuaniaLow & middle incomeLow incomeLower middle incomeLuxembourgMacao SAR, ChinaMacedonia, FYRMadagascarMalawiMalaysiaMaldivesMaliMaltaMauritaniaMauritiusMexicoMiddle East & North AfricaMiddle East & North Africa (excluding high income)Middle East & North Africa (IDA & IBRD countries)Middle incomeMoldovaMongoliaMontenegroMoroccoMozambiqueMyanmarNauruNepalNetherlandsNew CaledoniaNew ZealandNicaraguaNigerNigeriaNorth AmericaNorwayOECD membersOmanOther small statesPacific island small statesPakistanPanamaPapua New GuineaParaguayPeruPhilippinesPolandPortugalPost-demographic dividendPre-demographic dividendQatarRomaniaRussian FederationRwandaSamoaSao Tome and PrincipeSaudi ArabiaSenegalSerbiaSeychellesSierra LeoneSingaporeSlovak RepublicSloveniaSmall statesSolomon IslandsSomaliaSouth AfricaSouth AsiaSouth Asia (IDA & IBRD)SpainSri LankaSt. Kitts and NevisSt. LuciaSt. Vincent and the GrenadinesSub-Saharan Africa Sub-Saharan Africa (excluding high income)Sub-Saharan Africa (IDA & IBRD countries)SudanSurinameSwedenSwitzerlandSyrian Arab RepublicTajikistanTanzaniaThailandTogoTongaTrinidad and TobagoTunisiaTurkeyTurkmenistanTuvaluUgandaUkraineUnited Arab EmiratesUnited KingdomUnited StatesUpper middle incomeUruguayUzbekistanVanuatuVenezuela, RBVietnamWorldYemen, Rep.ZambiaZimbabwe Timeline:
This timeline shows a graph from 1982 to 2015 of Maldives. No data until 1981. Number of actual observations by date: 34.
Source name:
World Development Indicators
Source organization:
World Bank staff estimates based data from International Monetary Fund's Direction of Trade database.
Categories, topics:
Private Sector, Trade
Last updated:
apr 23, 2017
Indicators value changes by year
Maximum:
86.424
jan 1, 1983
At the date of observation
Value
Absolute change
Change from previous value
jan 1, 1982
77.173
+77.173
0.0%
jan 1, 1983
86.424
+9.252
11.99%
jan 1, 1984
84.119
-2.306
-2.67%
jan 1, 1985
77.923
-6.195
-7.36%
jan 1, 1986
29.483
-48.44
-62.16%
jan 1, 1987
36.254
+6.771
22.97%
jan 1, 1988
22.176
-14.078
-38.83%
jan 1, 1989
31.939
+9.763
44.03%
jan 1, 1990
30.036
-1.903
-5.96%
jan 1, 1991
16.883
-13.153
-43.79%
jan 1, 1992
11.02
-5.863
-34.73%
jan 1, 1993
6.522
-4.497
-40.81%
jan 1, 1994
17.491
+10.969
168.17%
jan 1, 1995
9.192
-8.299
-47.45%
jan 1, 1996
1.302
-7.89
-85.84%
jan 1, 1997
9.671
+8.369
642.85%
jan 1, 1998
8.139
-1.532
-15.84%
jan 1, 1999
12.941
+4.802
59.0%
jan 1, 2000
17.093
+4.152
32.08%
jan 1, 2001
5.897
-11.196
-65.5%
jan 1, 2002
11.319
+5.422
91.93%
jan 1, 2003
15.5
+4.182
36.95%
jan 1, 2004
22.526
+7.026
45.33%
jan 1, 2005
24.868
+2.342
10.4%
jan 1, 2006
23.374
-1.495
-6.01%
jan 1, 2007
37.624
+14.251
60.97%
jan 1, 2008
35.429
-2.195
-5.83%
jan 1, 2009
38.818
+3.389
9.57%
jan 1, 2010
21.277
-17.542
-45.19%
jan 1, 2011
28.095
+6.818
32.05%
jan 1, 2012
24.033
-4.062
-14.46%
jan 1, 2013
20.65
-3.383
-14.08%
jan 1, 2014
34.182
+13.531
65.53%
jan 1, 2015
23.121
-11.061
-32.36%
Ranking of countries by current statistics by years


Comments: