29
/
en
AIzaSyAYiBZKx7MnpbEhh9jyipgxe19OcubqV5w
April 1, 2024
85277
Bermuda
BMU
true
2
1
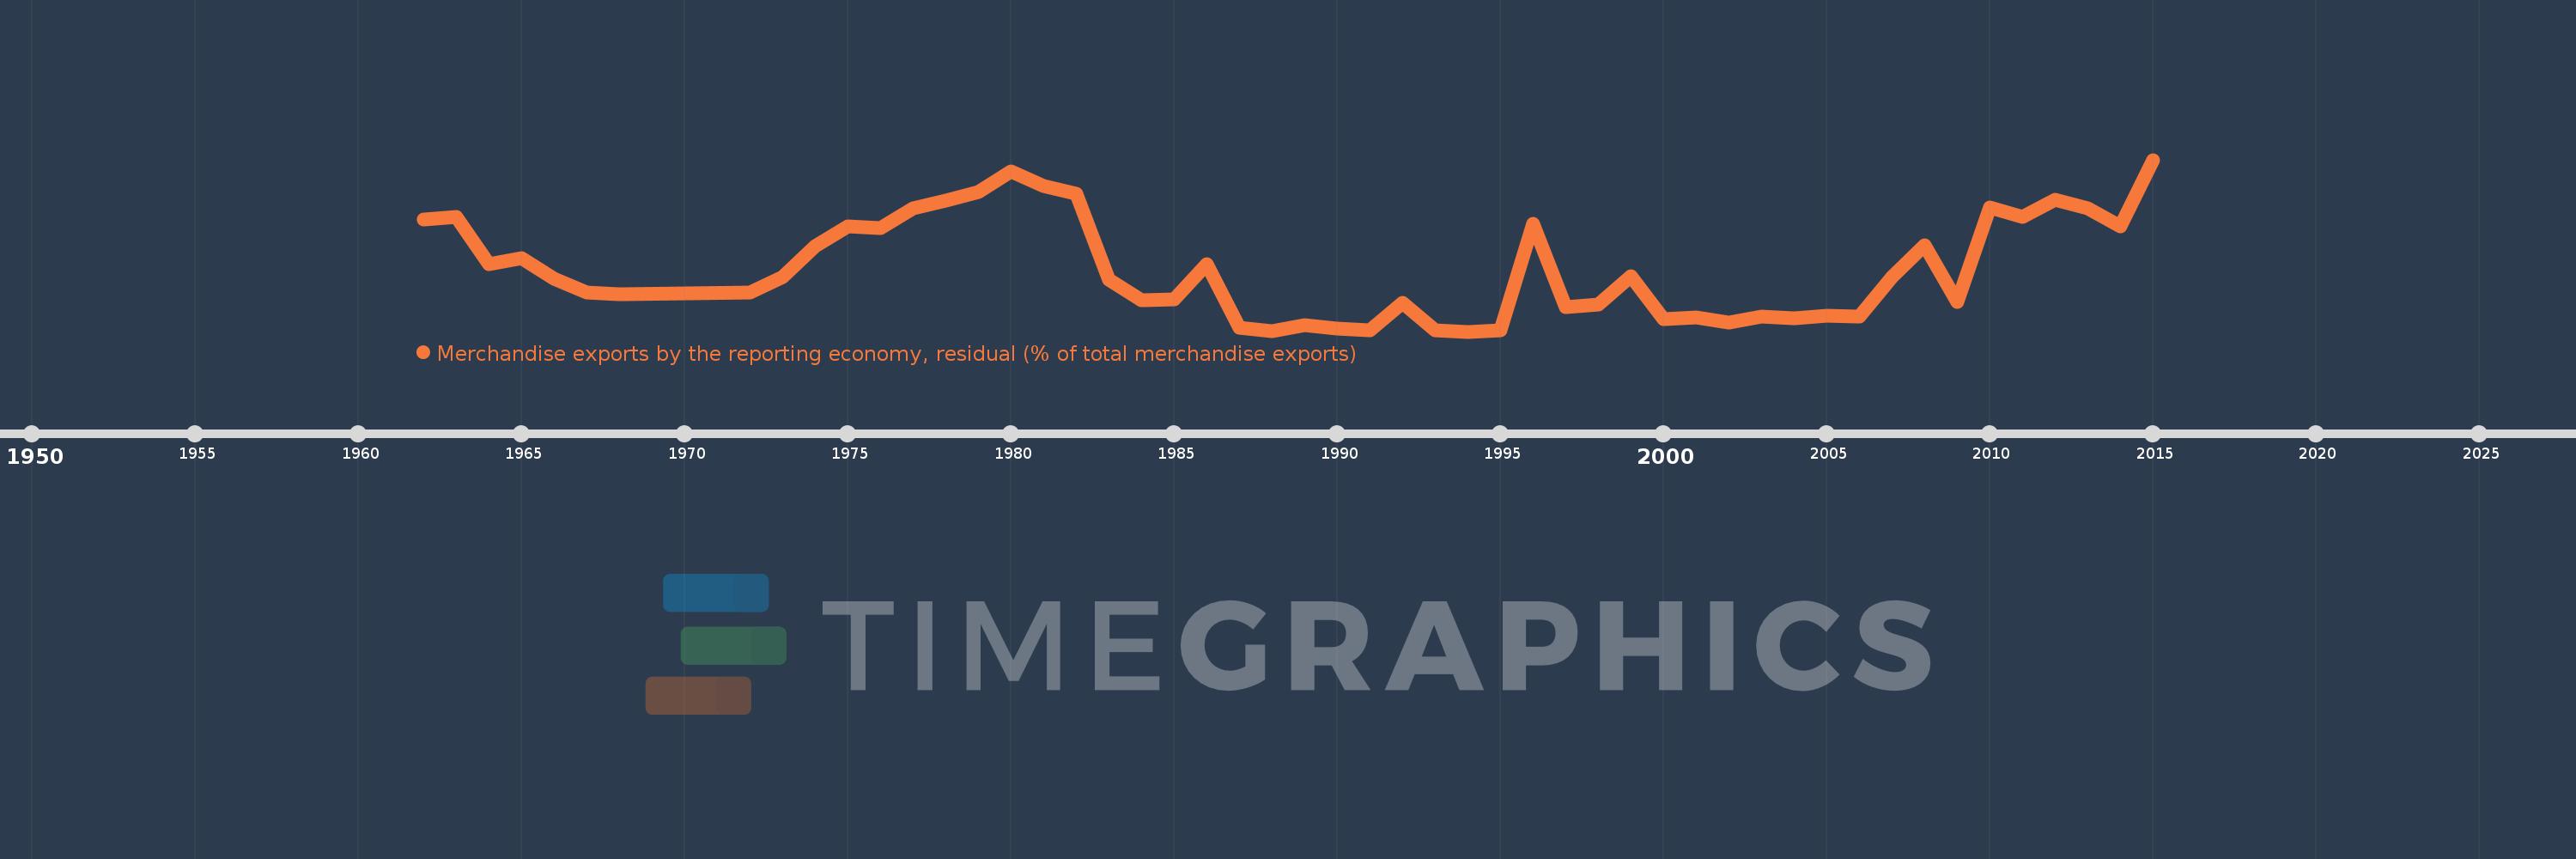
Merchandise exports by the reporting economy, residual (% of total merchandise exports)
2015,2014,2013,2012,2011,2010,2009,2008,2007,2006,2005,2004,2003,2002,2001,2000,1999,1998,1997,1996,1995,1994,1993,1992,1991,1990,1989,1988,1987,1986,1985,1984,1983,1982,1981,1980,1979,1978,1977,1976,1975,1974,1973,1972,1968,1967,1966,1965,1964,1963,1962
This statistics in other country:
AfghanistanAlbaniaAlgeriaAmerican SamoaAngolaAntigua and BarbudaArab WorldArgentinaArmeniaArubaAustraliaAustriaAzerbaijanBahamas, TheBahrainBangladeshBarbadosBelarusBelgiumBelizeBeninBermudaBoliviaBosnia and HerzegovinaBrazilBrunei DarussalamBulgariaBurkina FasoBurundiCabo VerdeCambodiaCameroonCanadaCaribbean small statesCentral African RepublicCentral Europe and the BalticsChadChileChinaColombiaComorosCongo, Dem. Rep.Congo, Rep.Costa RicaCote d'IvoireCroatiaCubaCyprusCzech RepublicDenmarkDjiboutiDominicaDominican RepublicEarly-demographic dividendEast Asia & PacificEast Asia & Pacific (excluding high income)East Asia & Pacific (IDA & IBRD countries)EcuadorEgypt, Arab Rep.El SalvadorEquatorial GuineaEstoniaEthiopiaEuro areaEurope & Central AsiaEurope & Central Asia (excluding high income)Europe & Central Asia (IDA & IBRD countries)European UnionFaroe IslandsFijiFinlandFragile and conflict affected situationsFranceFrench PolynesiaGabonGambia, TheGeorgiaGermanyGhanaGibraltarGreeceGreenlandGrenadaGuamGuatemalaGuineaGuinea-BissauGuyanaHaitiHeavily indebted poor countries (HIPC)High incomeHondurasHong Kong SAR, ChinaHungaryIBRD onlyIcelandIDA & IBRD totalIDA blendIDA onlyIDA totalIndiaIndonesiaIran, Islamic Rep.IraqIrelandIsraelItalyJamaicaJapanJordanKazakhstanKenyaKiribatiKorea, Dem. People’s Rep.Korea, Rep.KosovoKuwaitKyrgyz RepublicLao PDRLate-demographic dividendLatin America & Caribbean Latin America & Caribbean (excluding high income)Latin America & the Caribbean (IDA & IBRD countries)LatviaLeast developed countries: UN classificationLebanonLiberiaLibyaLithuaniaLow & middle incomeLow incomeLower middle incomeLuxembourgMacao SAR, ChinaMacedonia, FYRMadagascarMalawiMalaysiaMaldivesMaliMaltaMauritaniaMauritiusMexicoMiddle East & North AfricaMiddle East & North Africa (excluding high income)Middle East & North Africa (IDA & IBRD countries)Middle incomeMoldovaMongoliaMontenegroMoroccoMozambiqueMyanmarNauruNepalNetherlandsNew CaledoniaNew ZealandNicaraguaNigerNigeriaNorth AmericaNorwayOECD membersOmanOther small statesPacific island small statesPakistanPanamaPapua New GuineaParaguayPeruPhilippinesPolandPortugalPost-demographic dividendPre-demographic dividendQatarRomaniaRussian FederationRwandaSamoaSao Tome and PrincipeSaudi ArabiaSenegalSerbiaSeychellesSierra LeoneSingaporeSlovak RepublicSloveniaSmall statesSolomon IslandsSomaliaSouth AfricaSouth AsiaSouth Asia (IDA & IBRD)SpainSri LankaSt. Kitts and NevisSt. LuciaSt. Vincent and the GrenadinesSub-Saharan Africa Sub-Saharan Africa (excluding high income)Sub-Saharan Africa (IDA & IBRD countries)SudanSurinameSwedenSwitzerlandSyrian Arab RepublicTajikistanTanzaniaThailandTogoTongaTrinidad and TobagoTunisiaTurkeyTurkmenistanTuvaluUgandaUkraineUnited Arab EmiratesUnited KingdomUnited StatesUpper middle incomeUruguayUzbekistanVanuatuVenezuela, RBVietnamWorldYemen, Rep.ZambiaZimbabwe Timeline:
This timeline shows a graph from 1962 to 2015 of Bermuda. No data until 1961. Number of actual observations by date: 51.
Source name:
World Development Indicators
Source organization:
World Bank staff estimates based data from International Monetary Fund's Direction of Trade database.
Categories, topics:
Private Sector, Trade
Last updated:
apr 23, 2017
Indicators value changes by year
Maximum:
70.107
jan 1, 2015
At the date of observation
Value
Absolute change
Change from previous value
jan 1, 1962
45.802
+45.802
0.0%
jan 1, 1963
47.104
+1.303
2.84%
jan 1, 1964
27.792
-19.312
-41.0%
jan 1, 1965
30.163
+2.371
8.53%
jan 1, 1966
21.755
-8.408
-27.88%
jan 1, 1967
16.262
-5.493
-25.25%
jan 1, 1968
15.449
-0.813
-5.0%
jan 1, 1972
16.408
+0.959
6.21%
jan 1, 1973
22.71
+6.302
38.41%
jan 1, 1974
35.148
+12.438
54.77%
jan 1, 1975
43.034
+7.886
22.44%
jan 1, 1976
42.583
-0.451
-1.05%
jan 1, 1977
50.531
+7.948
18.67%
jan 1, 1978
53.489
+2.957
5.85%
jan 1, 1979
56.991
+3.502
6.55%
jan 1, 1980
65.353
+8.362
14.67%
jan 1, 1981
59.506
-5.847
-8.95%
jan 1, 1982
56.421
-3.085
-5.18%
jan 1, 1983
21.48
-34.942
-61.93%
jan 1, 1984
13.313
-8.167
-38.02%
jan 1, 1985
13.62
+0.307
2.31%
jan 1, 1986
27.921
+14.301
105.0%
jan 1, 1987
1.96
-25.961
-92.98%
jan 1, 1988
0.442
-1.518
-77.45%
jan 1, 1989
2.92
+2.477
560.37%
jan 1, 1990
1.701
-1.218
-41.73%
jan 1, 1991
0.899
-0.802
-47.16%
jan 1, 1992
12.267
+11.368
1.26K%
jan 1, 1993
1.101
-11.166
-91.02%
jan 1, 1994
0.433
-0.668
-60.64%
jan 1, 1995
0.805
+0.372
85.78%
jan 1, 1996
44.023
+43.217
5.37K%
jan 1, 1997
10.531
-33.491
-76.08%
jan 1, 1998
11.552
+1.021
9.69%
jan 1, 1999
22.864
+11.312
97.93%
jan 1, 2000
5.487
-17.377
-76.0%
jan 1, 2001
6.267
+0.779
14.2%
jan 1, 2002
4.119
-2.148
-34.27%
jan 1, 2003
6.562
+2.443
59.31%
jan 1, 2004
5.675
-0.888
-13.53%
jan 1, 2005
6.755
+1.08
19.03%
jan 1, 2006
6.663
-0.092
-1.36%
jan 1, 2007
22.602
+15.939
239.21%
jan 1, 2008
35.472
+12.87
56.94%
jan 1, 2009
12.399
-23.073
-65.05%
jan 1, 2010
50.717
+38.318
309.04%
jan 1, 2011
46.925
-3.792
-7.48%
jan 1, 2012
53.826
+6.901
14.71%
jan 1, 2013
50.395
-3.431
-6.37%
jan 1, 2014
43.223
-7.171
-14.23%
jan 1, 2015
70.107
+26.883
62.2%
Ranking of countries by current statistics by years


Comments: