29
/
en
AIzaSyAYiBZKx7MnpbEhh9jyipgxe19OcubqV5w
April 1, 2024
122411
Dominican Republic
DOM
true
2
1
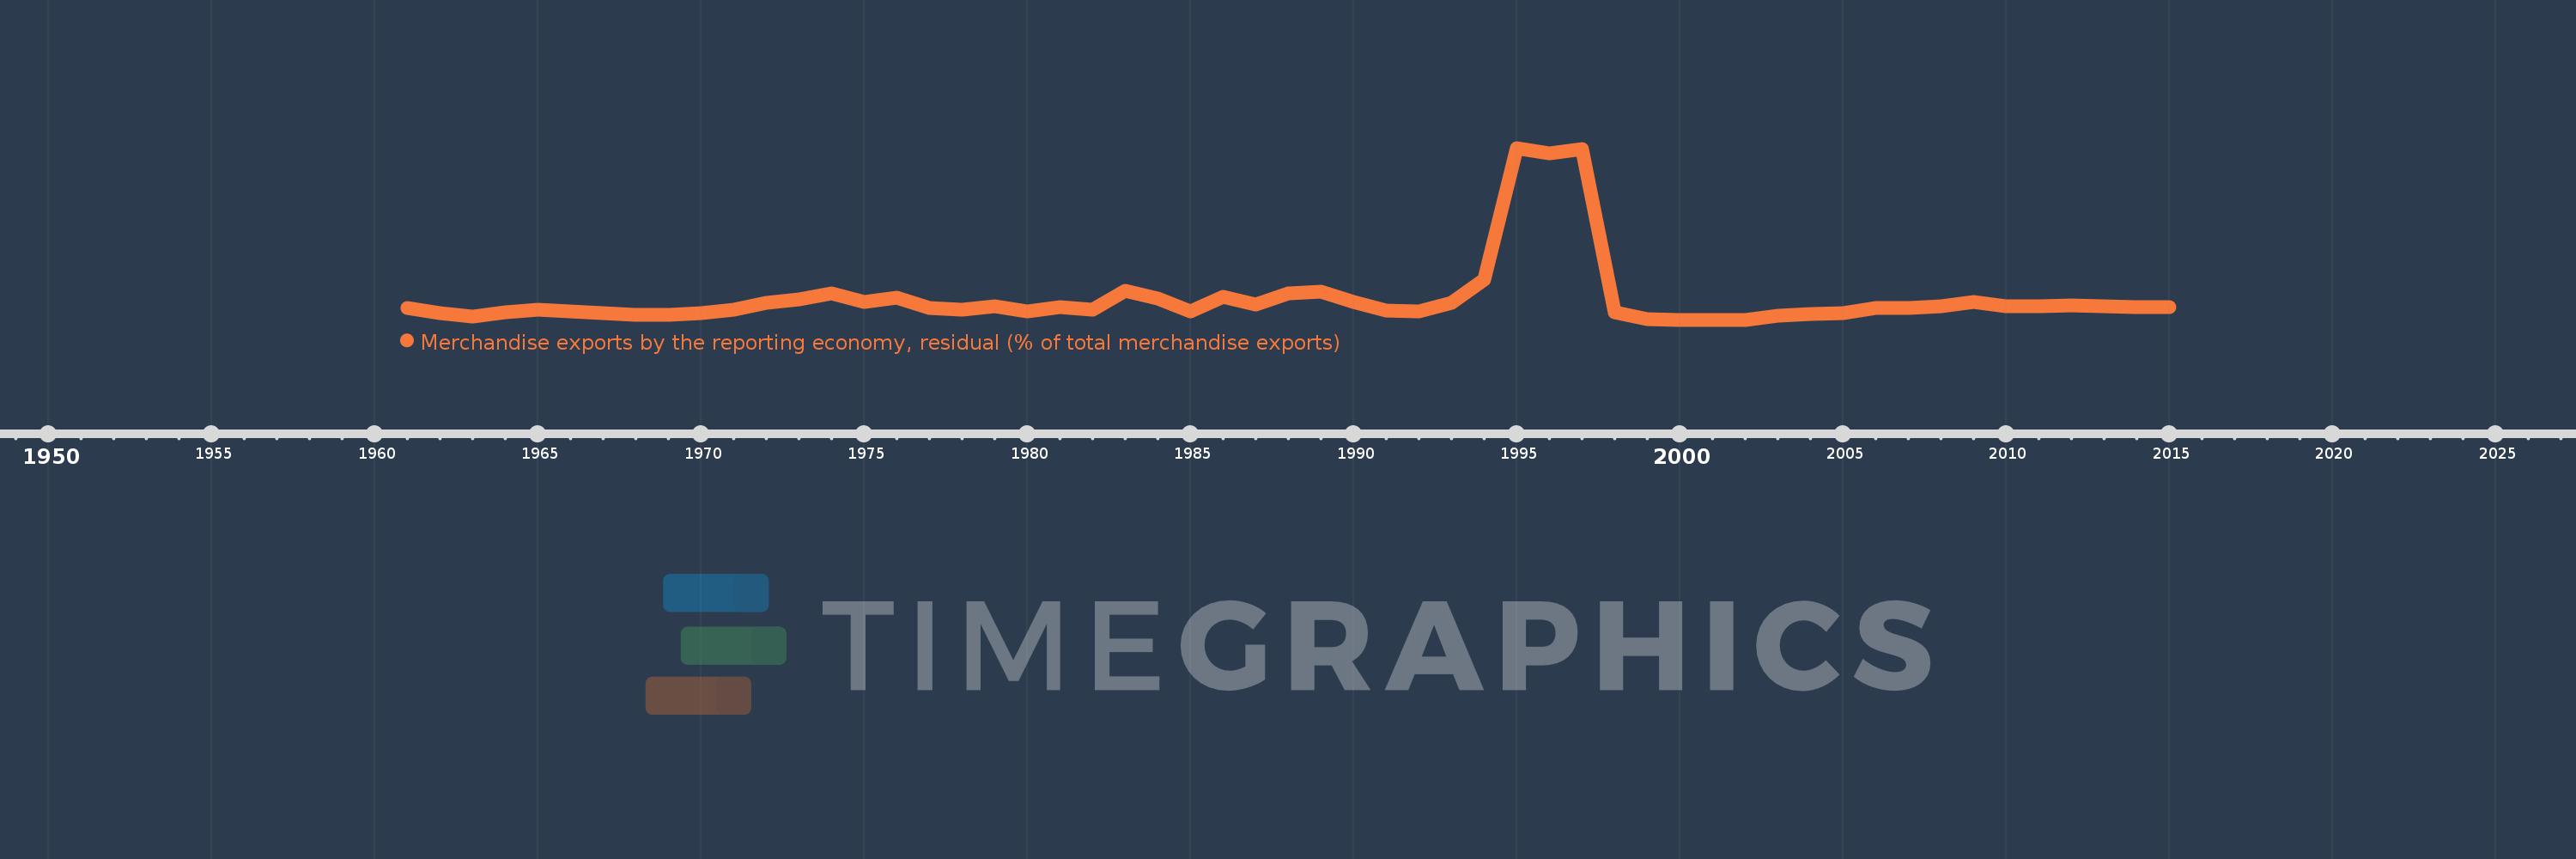
Merchandise exports by the reporting economy, residual (% of total merchandise exports)
2015,2014,2013,2012,2011,2010,2009,2008,2007,2006,2005,2004,2003,2002,2001,2000,1999,1998,1997,1996,1995,1994,1993,1992,1991,1990,1989,1988,1987,1986,1985,1984,1983,1982,1981,1980,1979,1978,1977,1976,1975,1974,1973,1972,1971,1970,1969,1968,1967,1966,1965,1964,1963,1962,1961
This statistics in other country:
AfghanistanAlbaniaAlgeriaAmerican SamoaAngolaAntigua and BarbudaArab WorldArgentinaArmeniaArubaAustraliaAustriaAzerbaijanBahamas, TheBahrainBangladeshBarbadosBelarusBelgiumBelizeBeninBermudaBoliviaBosnia and HerzegovinaBrazilBrunei DarussalamBulgariaBurkina FasoBurundiCabo VerdeCambodiaCameroonCanadaCaribbean small statesCentral African RepublicCentral Europe and the BalticsChadChileChinaColombiaComorosCongo, Dem. Rep.Congo, Rep.Costa RicaCote d'IvoireCroatiaCubaCyprusCzech RepublicDenmarkDjiboutiDominicaDominican RepublicEarly-demographic dividendEast Asia & PacificEast Asia & Pacific (excluding high income)East Asia & Pacific (IDA & IBRD countries)EcuadorEgypt, Arab Rep.El SalvadorEquatorial GuineaEstoniaEthiopiaEuro areaEurope & Central AsiaEurope & Central Asia (excluding high income)Europe & Central Asia (IDA & IBRD countries)European UnionFaroe IslandsFijiFinlandFragile and conflict affected situationsFranceFrench PolynesiaGabonGambia, TheGeorgiaGermanyGhanaGibraltarGreeceGreenlandGrenadaGuamGuatemalaGuineaGuinea-BissauGuyanaHaitiHeavily indebted poor countries (HIPC)High incomeHondurasHong Kong SAR, ChinaHungaryIBRD onlyIcelandIDA & IBRD totalIDA blendIDA onlyIDA totalIndiaIndonesiaIran, Islamic Rep.IraqIrelandIsraelItalyJamaicaJapanJordanKazakhstanKenyaKiribatiKorea, Dem. People’s Rep.Korea, Rep.KosovoKuwaitKyrgyz RepublicLao PDRLate-demographic dividendLatin America & Caribbean Latin America & Caribbean (excluding high income)Latin America & the Caribbean (IDA & IBRD countries)LatviaLeast developed countries: UN classificationLebanonLiberiaLibyaLithuaniaLow & middle incomeLow incomeLower middle incomeLuxembourgMacao SAR, ChinaMacedonia, FYRMadagascarMalawiMalaysiaMaldivesMaliMaltaMauritaniaMauritiusMexicoMiddle East & North AfricaMiddle East & North Africa (excluding high income)Middle East & North Africa (IDA & IBRD countries)Middle incomeMoldovaMongoliaMontenegroMoroccoMozambiqueMyanmarNauruNepalNetherlandsNew CaledoniaNew ZealandNicaraguaNigerNigeriaNorth AmericaNorwayOECD membersOmanOther small statesPacific island small statesPakistanPanamaPapua New GuineaParaguayPeruPhilippinesPolandPortugalPost-demographic dividendPre-demographic dividendQatarRomaniaRussian FederationRwandaSamoaSao Tome and PrincipeSaudi ArabiaSenegalSerbiaSeychellesSierra LeoneSingaporeSlovak RepublicSloveniaSmall statesSolomon IslandsSomaliaSouth AfricaSouth AsiaSouth Asia (IDA & IBRD)SpainSri LankaSt. Kitts and NevisSt. LuciaSt. Vincent and the GrenadinesSub-Saharan Africa Sub-Saharan Africa (excluding high income)Sub-Saharan Africa (IDA & IBRD countries)SudanSurinameSwedenSwitzerlandSyrian Arab RepublicTajikistanTanzaniaThailandTogoTongaTrinidad and TobagoTunisiaTurkeyTurkmenistanTuvaluUgandaUkraineUnited Arab EmiratesUnited KingdomUnited StatesUpper middle incomeUruguayUzbekistanVanuatuVenezuela, RBVietnamWorldYemen, Rep.ZambiaZimbabwe Timeline:
This timeline shows a graph from 1961 to 2015 of Dominican Republic. No data until 1960. Number of actual observations by date: 55.
Source name:
World Development Indicators
Source organization:
World Bank staff estimates based data from International Monetary Fund's Direction of Trade database.
Categories, topics:
Private Sector, Trade
Last updated:
apr 23, 2017
Indicators value changes by year
Maximum:
83.913
jan 1, 1995
At the date of observation
Value
Absolute change
Change from previous value
jan 1, 1961
5.938
+5.938
0.0%
jan 1, 1962
3.456
-2.482
-41.8%
jan 1, 1963
1.753
-1.702
-49.26%
jan 1, 1964
3.847
+2.094
119.42%
jan 1, 1965
5.134
+1.287
33.46%
jan 1, 1966
4.267
-0.868
-16.9%
jan 1, 1967
3.477
-0.79
-18.51%
jan 1, 1968
2.804
-0.673
-19.35%
jan 1, 1969
2.631
-0.173
-6.17%
jan 1, 1970
3.346
+0.715
27.17%
jan 1, 1971
5.038
+1.692
50.57%
jan 1, 1972
8.67
+3.632
72.09%
jan 1, 1973
10.051
+1.381
15.92%
jan 1, 1974
13.252
+3.201
31.85%
jan 1, 1975
8.811
-4.441
-33.51%
jan 1, 1976
10.92
+2.109
23.94%
jan 1, 1977
5.955
-4.965
-45.46%
jan 1, 1978
4.939
-1.016
-17.06%
jan 1, 1979
6.653
+1.713
34.69%
jan 1, 1980
4.301
-2.351
-35.34%
jan 1, 1981
6.418
+2.116
49.21%
jan 1, 1982
5.274
-1.144
-17.83%
jan 1, 1983
14.15
+8.876
168.31%
jan 1, 1984
10.422
-3.729
-26.35%
jan 1, 1985
4.225
-6.197
-59.46%
jan 1, 1986
11.241
+7.016
166.07%
jan 1, 1987
7.484
-3.757
-33.42%
jan 1, 1988
13.081
+5.597
74.79%
jan 1, 1989
13.855
+0.774
5.92%
jan 1, 1990
8.771
-5.084
-36.69%
jan 1, 1991
4.881
-3.89
-44.35%
jan 1, 1992
4.373
-0.508
-10.4%
jan 1, 1993
8.598
+4.225
96.62%
jan 1, 1994
19.83
+11.232
130.63%
jan 1, 1995
83.913
+64.083
323.16%
jan 1, 1996
81.171
-2.742
-3.27%
jan 1, 1997
83.22
+2.049
2.52%
jan 1, 1998
3.803
-79.417
-95.43%
jan 1, 1999
0.325
-3.478
-91.46%
jan 1, 2000
0.226
-0.098
-30.33%
jan 1, 2001
0.273
+0.046
20.51%
jan 1, 2002
0.221
-0.051
-18.85%
jan 1, 2003
2.376
+2.155
974.14%
jan 1, 2004
2.971
+0.594
25.01%
jan 1, 2005
3.309
+0.338
11.38%
jan 1, 2006
5.812
+2.504
75.67%
jan 1, 2007
6.066
+0.254
4.37%
jan 1, 2008
6.796
+0.729
12.02%
jan 1, 2009
8.898
+2.102
30.93%
jan 1, 2010
6.974
-1.924
-21.62%
jan 1, 2011
6.828
-0.145
-2.08%
jan 1, 2012
7.351
+0.523
7.65%
jan 1, 2013
6.986
-0.365
-4.97%
jan 1, 2014
6.339
-0.646
-9.25%
jan 1, 2015
6.273
-0.066
-1.04%
Ranking of countries by current statistics by years


Comments: