29
/
en
AIzaSyAYiBZKx7MnpbEhh9jyipgxe19OcubqV5w
April 1, 2024
148199
Guyana
GUY
true
2
1
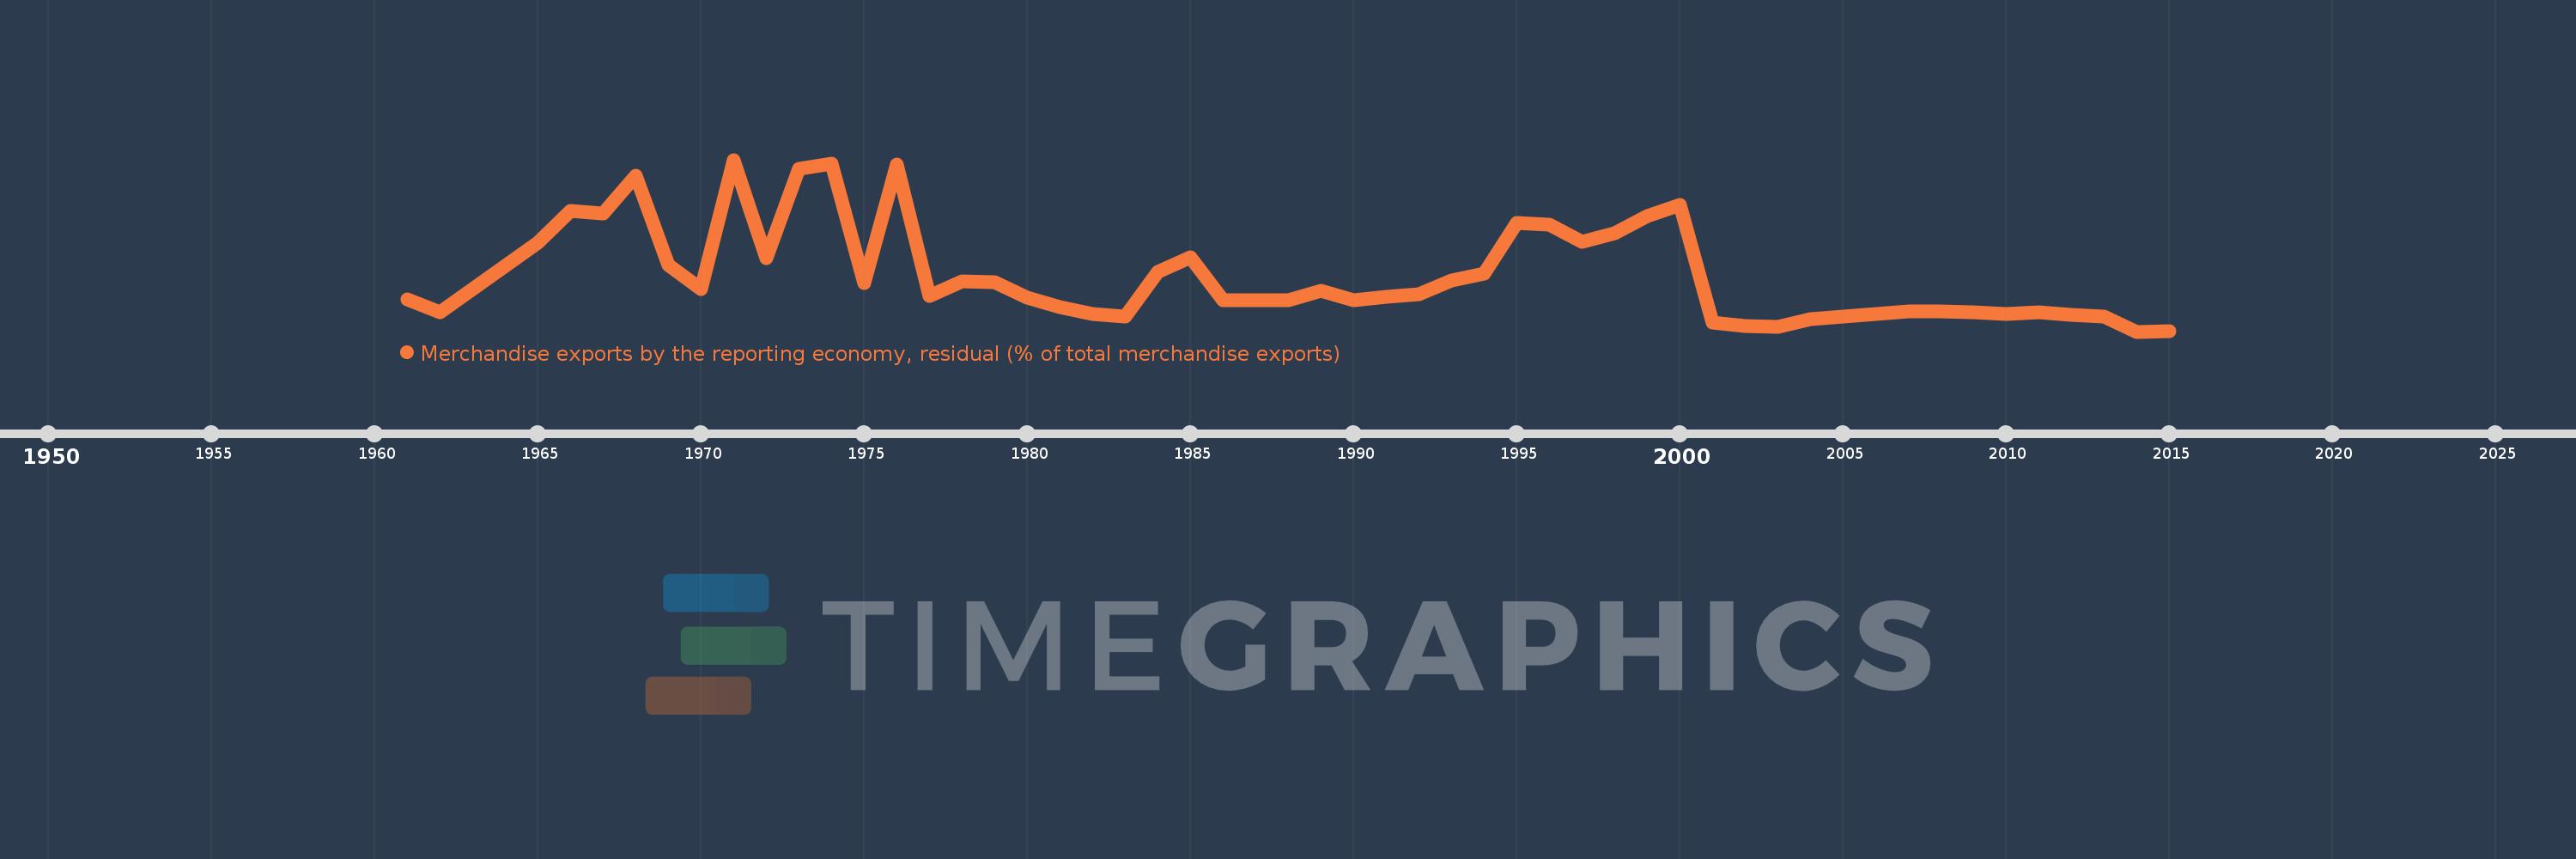
Merchandise exports by the reporting economy, residual (% of total merchandise exports)
2015,2014,2013,2012,2011,2010,2009,2008,2007,2006,2005,2004,2003,2002,2001,2000,1999,1998,1997,1996,1995,1994,1993,1992,1991,1990,1989,1988,1987,1986,1985,1984,1983,1982,1981,1980,1979,1978,1977,1976,1975,1974,1973,1972,1971,1970,1969,1968,1967,1966,1965,1962,1961
This statistics in other country:
AfghanistanAlbaniaAlgeriaAmerican SamoaAngolaAntigua and BarbudaArab WorldArgentinaArmeniaArubaAustraliaAustriaAzerbaijanBahamas, TheBahrainBangladeshBarbadosBelarusBelgiumBelizeBeninBermudaBoliviaBosnia and HerzegovinaBrazilBrunei DarussalamBulgariaBurkina FasoBurundiCabo VerdeCambodiaCameroonCanadaCaribbean small statesCentral African RepublicCentral Europe and the BalticsChadChileChinaColombiaComorosCongo, Dem. Rep.Congo, Rep.Costa RicaCote d'IvoireCroatiaCubaCyprusCzech RepublicDenmarkDjiboutiDominicaDominican RepublicEarly-demographic dividendEast Asia & PacificEast Asia & Pacific (excluding high income)East Asia & Pacific (IDA & IBRD countries)EcuadorEgypt, Arab Rep.El SalvadorEquatorial GuineaEstoniaEthiopiaEuro areaEurope & Central AsiaEurope & Central Asia (excluding high income)Europe & Central Asia (IDA & IBRD countries)European UnionFaroe IslandsFijiFinlandFragile and conflict affected situationsFranceFrench PolynesiaGabonGambia, TheGeorgiaGermanyGhanaGibraltarGreeceGreenlandGrenadaGuamGuatemalaGuineaGuinea-BissauGuyanaHaitiHeavily indebted poor countries (HIPC)High incomeHondurasHong Kong SAR, ChinaHungaryIBRD onlyIcelandIDA & IBRD totalIDA blendIDA onlyIDA totalIndiaIndonesiaIran, Islamic Rep.IraqIrelandIsraelItalyJamaicaJapanJordanKazakhstanKenyaKiribatiKorea, Dem. People’s Rep.Korea, Rep.KosovoKuwaitKyrgyz RepublicLao PDRLate-demographic dividendLatin America & Caribbean Latin America & Caribbean (excluding high income)Latin America & the Caribbean (IDA & IBRD countries)LatviaLeast developed countries: UN classificationLebanonLiberiaLibyaLithuaniaLow & middle incomeLow incomeLower middle incomeLuxembourgMacao SAR, ChinaMacedonia, FYRMadagascarMalawiMalaysiaMaldivesMaliMaltaMauritaniaMauritiusMexicoMiddle East & North AfricaMiddle East & North Africa (excluding high income)Middle East & North Africa (IDA & IBRD countries)Middle incomeMoldovaMongoliaMontenegroMoroccoMozambiqueMyanmarNauruNepalNetherlandsNew CaledoniaNew ZealandNicaraguaNigerNigeriaNorth AmericaNorwayOECD membersOmanOther small statesPacific island small statesPakistanPanamaPapua New GuineaParaguayPeruPhilippinesPolandPortugalPost-demographic dividendPre-demographic dividendQatarRomaniaRussian FederationRwandaSamoaSao Tome and PrincipeSaudi ArabiaSenegalSerbiaSeychellesSierra LeoneSingaporeSlovak RepublicSloveniaSmall statesSolomon IslandsSomaliaSouth AfricaSouth AsiaSouth Asia (IDA & IBRD)SpainSri LankaSt. Kitts and NevisSt. LuciaSt. Vincent and the GrenadinesSub-Saharan Africa Sub-Saharan Africa (excluding high income)Sub-Saharan Africa (IDA & IBRD countries)SudanSurinameSwedenSwitzerlandSyrian Arab RepublicTajikistanTanzaniaThailandTogoTongaTrinidad and TobagoTunisiaTurkeyTurkmenistanTuvaluUgandaUkraineUnited Arab EmiratesUnited KingdomUnited StatesUpper middle incomeUruguayUzbekistanVanuatuVenezuela, RBVietnamWorldYemen, Rep.ZambiaZimbabwe Timeline:
This timeline shows a graph from 1961 to 2015 of Guyana. No data until 1960. Number of actual observations by date: 53.
Source name:
World Development Indicators
Source organization:
World Bank staff estimates based data from International Monetary Fund's Direction of Trade database.
Categories, topics:
Private Sector, Trade
Last updated:
apr 23, 2017
Indicators value changes by year
Maximum:
14.598
jan 1, 1971
At the date of observation
Value
Absolute change
Change from previous value
jan 1, 1961
2.826
+2.826
0.0%
jan 1, 1962
1.726
-1.1
-38.93%
jan 1, 1965
7.587
+5.861
339.54%
jan 1, 1966
10.277
+2.691
35.46%
jan 1, 1967
10.082
-0.195
-1.9%
jan 1, 1968
13.268
+3.186
31.59%
jan 1, 1969
5.699
-7.57
-57.05%
jan 1, 1970
3.703
-1.996
-35.02%
jan 1, 1971
14.598
+10.895
294.22%
jan 1, 1972
6.308
-8.29
-56.79%
jan 1, 1973
13.861
+7.553
119.74%
jan 1, 1974
14.26
+0.4
2.88%
jan 1, 1975
4.196
-10.064
-70.57%
jan 1, 1976
14.193
+9.997
238.22%
jan 1, 1977
3.07
-11.123
-78.37%
jan 1, 1978
4.344
+1.274
41.52%
jan 1, 1979
4.261
-0.083
-1.92%
jan 1, 1980
2.952
-1.309
-30.71%
jan 1, 1981
2.168
-0.785
-26.58%
jan 1, 1982
1.546
-0.622
-28.68%
jan 1, 1983
1.356
-0.19
-12.32%
jan 1, 1984
5.132
+3.776
278.59%
jan 1, 1985
6.355
+1.223
23.84%
jan 1, 1986
2.759
-3.597
-56.6%
jan 1, 1987
2.759
0.0
0.0%
jan 1, 1988
2.759
+0.0
0.0%
jan 1, 1989
3.501
+0.743
26.93%
jan 1, 1990
2.759
-0.743
-21.22%
jan 1, 1991
3.045
+0.287
10.39%
jan 1, 1992
3.221
+0.176
5.79%
jan 1, 1993
4.439
+1.218
37.8%
jan 1, 1994
4.987
+0.548
12.34%
jan 1, 1995
9.26
+4.274
85.7%
jan 1, 1996
9.093
-0.167
-1.81%
jan 1, 1997
7.669
-1.424
-15.66%
jan 1, 1998
8.362
+0.693
9.04%
jan 1, 1999
9.852
+1.49
17.82%
jan 1, 2000
10.763
+0.911
9.24%
jan 1, 2001
0.883
-9.879
-91.79%
jan 1, 2002
0.566
-0.317
-35.91%
jan 1, 2003
0.485
-0.082
-14.42%
jan 1, 2004
1.16
+0.675
139.34%
jan 1, 2005
1.352
+0.192
16.56%
jan 1, 2006
1.55
+0.198
14.67%
jan 1, 2007
1.772
+0.222
14.33%
jan 1, 2008
1.816
+0.044
2.48%
jan 1, 2009
1.69
-0.126
-6.94%
jan 1, 2010
1.558
-0.132
-7.82%
jan 1, 2011
1.693
+0.135
8.66%
jan 1, 2012
1.516
-0.177
-10.47%
jan 1, 2013
1.349
-0.167
-11.0%
jan 1, 2014
0.091
-1.258
-93.25%
jan 1, 2015
0.095
+0.004
4.56%
Ranking of countries by current statistics by years


Comments: