29
/
en
AIzaSyAYiBZKx7MnpbEhh9jyipgxe19OcubqV5w
April 1, 2024
203188
Mozambique
MOZ
true
2
1
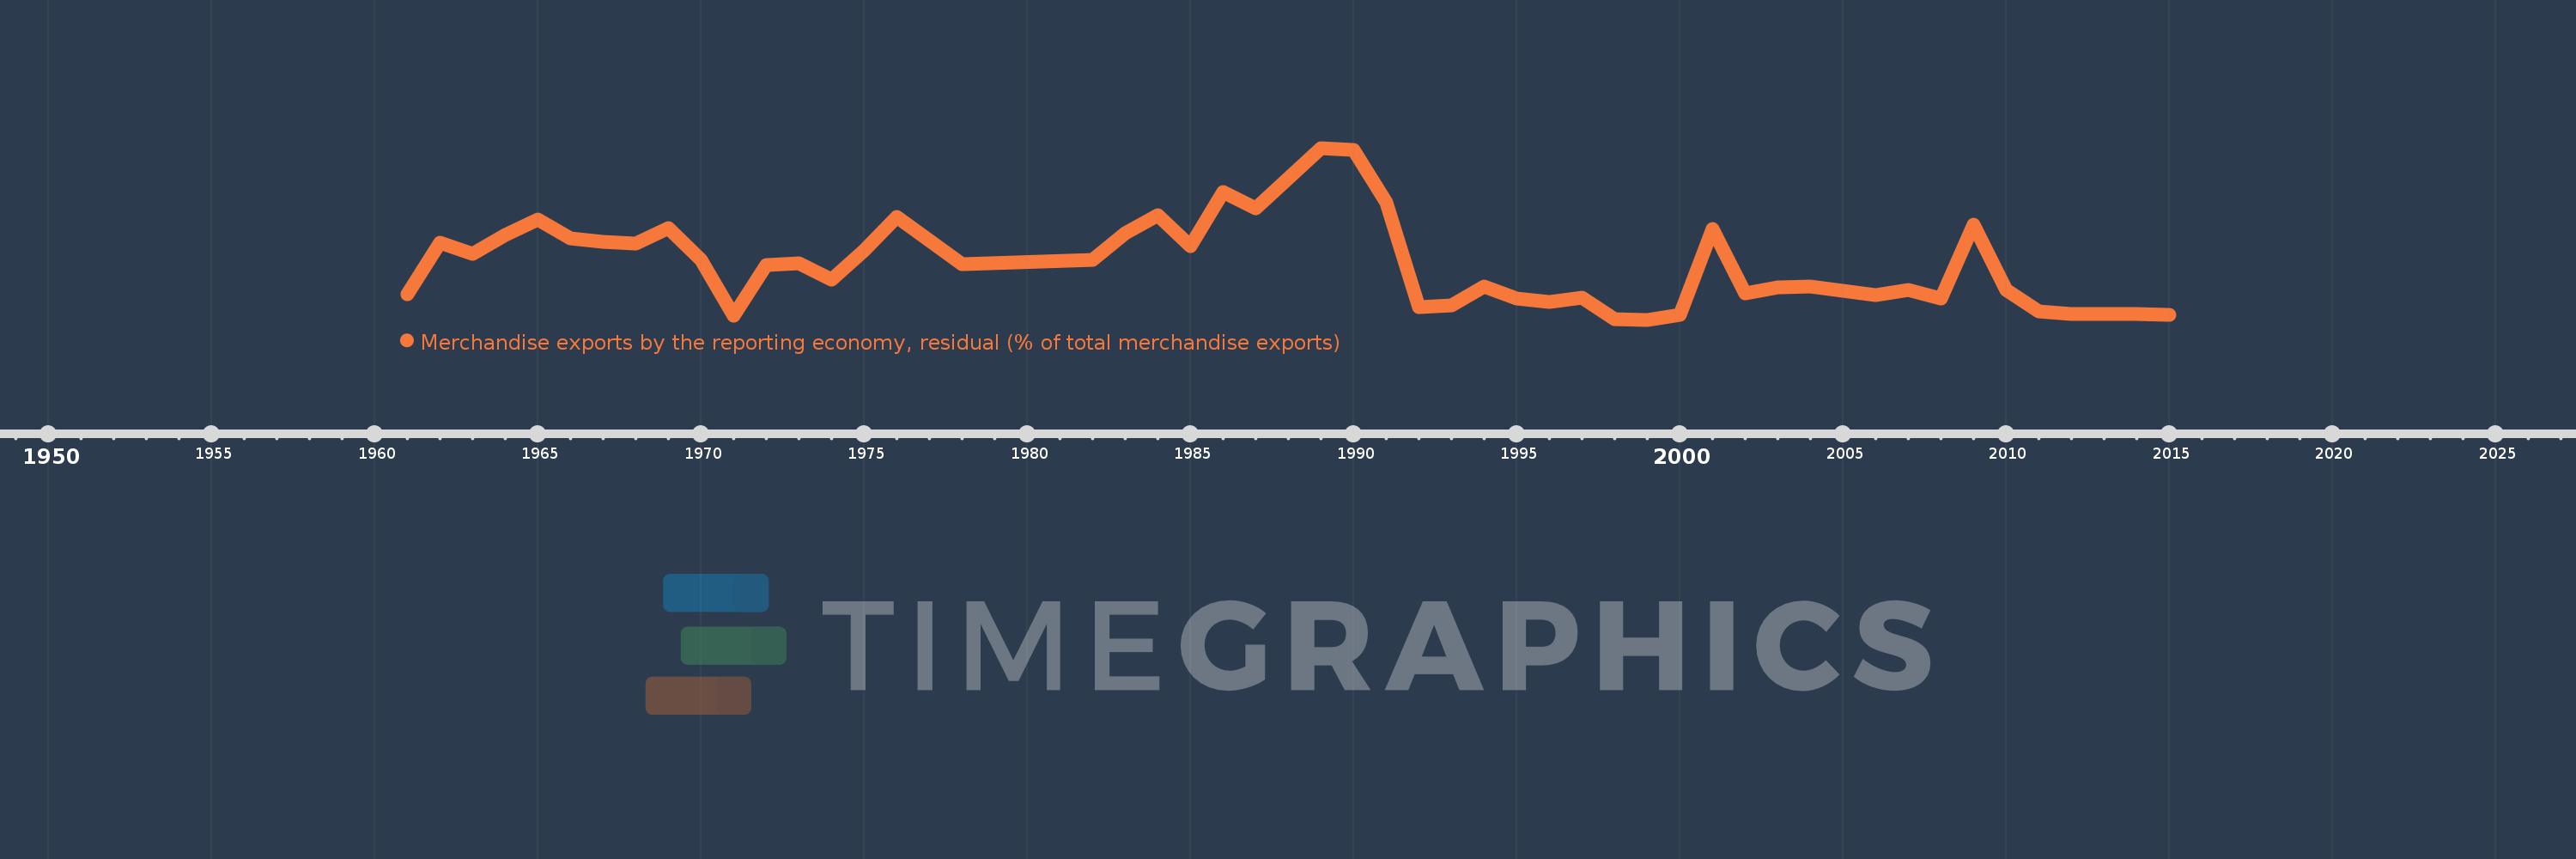
Merchandise exports by the reporting economy, residual (% of total merchandise exports)
2015,2014,2013,2012,2011,2010,2009,2008,2007,2006,2005,2004,2003,2002,2001,2000,1999,1998,1997,1996,1995,1994,1993,1992,1991,1990,1989,1988,1987,1986,1985,1984,1983,1982,1978,1976,1975,1974,1973,1972,1971,1970,1969,1968,1967,1966,1965,1964,1963,1962,1961
This statistics in other country:
AfghanistanAlbaniaAlgeriaAmerican SamoaAngolaAntigua and BarbudaArab WorldArgentinaArmeniaArubaAustraliaAustriaAzerbaijanBahamas, TheBahrainBangladeshBarbadosBelarusBelgiumBelizeBeninBermudaBoliviaBosnia and HerzegovinaBrazilBrunei DarussalamBulgariaBurkina FasoBurundiCabo VerdeCambodiaCameroonCanadaCaribbean small statesCentral African RepublicCentral Europe and the BalticsChadChileChinaColombiaComorosCongo, Dem. Rep.Congo, Rep.Costa RicaCote d'IvoireCroatiaCubaCyprusCzech RepublicDenmarkDjiboutiDominicaDominican RepublicEarly-demographic dividendEast Asia & PacificEast Asia & Pacific (excluding high income)East Asia & Pacific (IDA & IBRD countries)EcuadorEgypt, Arab Rep.El SalvadorEquatorial GuineaEstoniaEthiopiaEuro areaEurope & Central AsiaEurope & Central Asia (excluding high income)Europe & Central Asia (IDA & IBRD countries)European UnionFaroe IslandsFijiFinlandFragile and conflict affected situationsFranceFrench PolynesiaGabonGambia, TheGeorgiaGermanyGhanaGibraltarGreeceGreenlandGrenadaGuamGuatemalaGuineaGuinea-BissauGuyanaHaitiHeavily indebted poor countries (HIPC)High incomeHondurasHong Kong SAR, ChinaHungaryIBRD onlyIcelandIDA & IBRD totalIDA blendIDA onlyIDA totalIndiaIndonesiaIran, Islamic Rep.IraqIrelandIsraelItalyJamaicaJapanJordanKazakhstanKenyaKiribatiKorea, Dem. People’s Rep.Korea, Rep.KosovoKuwaitKyrgyz RepublicLao PDRLate-demographic dividendLatin America & Caribbean Latin America & Caribbean (excluding high income)Latin America & the Caribbean (IDA & IBRD countries)LatviaLeast developed countries: UN classificationLebanonLiberiaLibyaLithuaniaLow & middle incomeLow incomeLower middle incomeLuxembourgMacao SAR, ChinaMacedonia, FYRMadagascarMalawiMalaysiaMaldivesMaliMaltaMauritaniaMauritiusMexicoMiddle East & North AfricaMiddle East & North Africa (excluding high income)Middle East & North Africa (IDA & IBRD countries)Middle incomeMoldovaMongoliaMontenegroMoroccoMozambiqueMyanmarNauruNepalNetherlandsNew CaledoniaNew ZealandNicaraguaNigerNigeriaNorth AmericaNorwayOECD membersOmanOther small statesPacific island small statesPakistanPanamaPapua New GuineaParaguayPeruPhilippinesPolandPortugalPost-demographic dividendPre-demographic dividendQatarRomaniaRussian FederationRwandaSamoaSao Tome and PrincipeSaudi ArabiaSenegalSerbiaSeychellesSierra LeoneSingaporeSlovak RepublicSloveniaSmall statesSolomon IslandsSomaliaSouth AfricaSouth AsiaSouth Asia (IDA & IBRD)SpainSri LankaSt. Kitts and NevisSt. LuciaSt. Vincent and the GrenadinesSub-Saharan Africa Sub-Saharan Africa (excluding high income)Sub-Saharan Africa (IDA & IBRD countries)SudanSurinameSwedenSwitzerlandSyrian Arab RepublicTajikistanTanzaniaThailandTogoTongaTrinidad and TobagoTunisiaTurkeyTurkmenistanTuvaluUgandaUkraineUnited Arab EmiratesUnited KingdomUnited StatesUpper middle incomeUruguayUzbekistanVanuatuVenezuela, RBVietnamWorldYemen, Rep.ZambiaZimbabwe Timeline:
This timeline shows a graph from 1961 to 2015 of Mozambique. No data until 1960. Number of actual observations by date: 51.
Source name:
World Development Indicators
Source organization:
World Bank staff estimates based data from International Monetary Fund's Direction of Trade database.
Categories, topics:
Private Sector, Trade
Last updated:
apr 23, 2017
Indicators value changes by year
Maximum:
38.157
jan 1, 1989
At the date of observation
Value
Absolute change
Change from previous value
jan 1, 1961
5.705
+5.705
0.0%
jan 1, 1962
17.184
+11.479
201.19%
jan 1, 1963
14.685
-2.499
-14.54%
jan 1, 1964
18.737
+4.052
27.59%
jan 1, 1965
22.18
+3.443
18.38%
jan 1, 1966
18.08
-4.1
-18.48%
jan 1, 1967
17.278
-0.802
-4.43%
jan 1, 1968
16.968
-0.311
-1.8%
jan 1, 1969
20.444
+3.476
20.49%
jan 1, 1970
13.215
-7.229
-35.36%
jan 1, 1971
0.955
-12.259
-92.77%
jan 1, 1972
12.244
+11.289
1.18K%
jan 1, 1973
12.466
+0.221
1.81%
jan 1, 1974
8.898
-3.568
-28.62%
jan 1, 1975
15.397
+6.498
73.03%
jan 1, 1976
22.898
+7.501
48.72%
jan 1, 1978
12.329
-10.569
-46.16%
jan 1, 1982
13.387
+1.058
8.58%
jan 1, 1983
19.214
+5.827
43.53%
jan 1, 1984
23.127
+3.913
20.37%
jan 1, 1985
16.298
-6.829
-29.53%
jan 1, 1986
28.37
+12.073
74.08%
jan 1, 1987
24.782
-3.588
-12.65%
jan 1, 1988
31.385
+6.603
26.64%
jan 1, 1989
38.157
+6.772
21.58%
jan 1, 1990
37.67
-0.487
-1.28%
jan 1, 1991
26.069
-11.601
-30.8%
jan 1, 1992
2.809
-23.26
-89.22%
jan 1, 1993
3.279
+0.47
16.74%
jan 1, 1994
7.39
+4.111
125.35%
jan 1, 1995
4.653
-2.737
-37.04%
jan 1, 1996
4.012
-0.641
-13.78%
jan 1, 1997
4.979
+0.967
24.11%
jan 1, 1998
0.045
-4.934
-99.1%
jan 1, 1999
0.0
-0.045
-100.0%
jan 1, 2000
1.107
+1.107
%
jan 1, 2001
20.258
+19.151
1.73K%
jan 1, 2002
5.928
-14.33
-70.74%
jan 1, 2003
7.264
+1.336
22.54%
jan 1, 2004
7.445
+0.181
2.49%
jan 1, 2005
6.407
-1.038
-13.94%
jan 1, 2006
5.493
-0.914
-14.27%
jan 1, 2007
6.525
+1.032
18.79%
jan 1, 2008
4.738
-1.786
-27.38%
jan 1, 2009
21.134
+16.395
346.01%
jan 1, 2010
6.589
-14.544
-68.82%
jan 1, 2011
1.806
-4.783
-72.59%
jan 1, 2012
1.277
-0.529
-29.3%
jan 1, 2013
1.189
-0.088
-6.89%
jan 1, 2014
1.205
+0.016
1.32%
jan 1, 2015
1.06
-0.145
-12.03%
Ranking of countries by current statistics by years


Comments: