29
/
en
AIzaSyAYiBZKx7MnpbEhh9jyipgxe19OcubqV5w
April 1, 2024
31811
Europe & Central Asia (excluding high income)
ECA
false
2
1
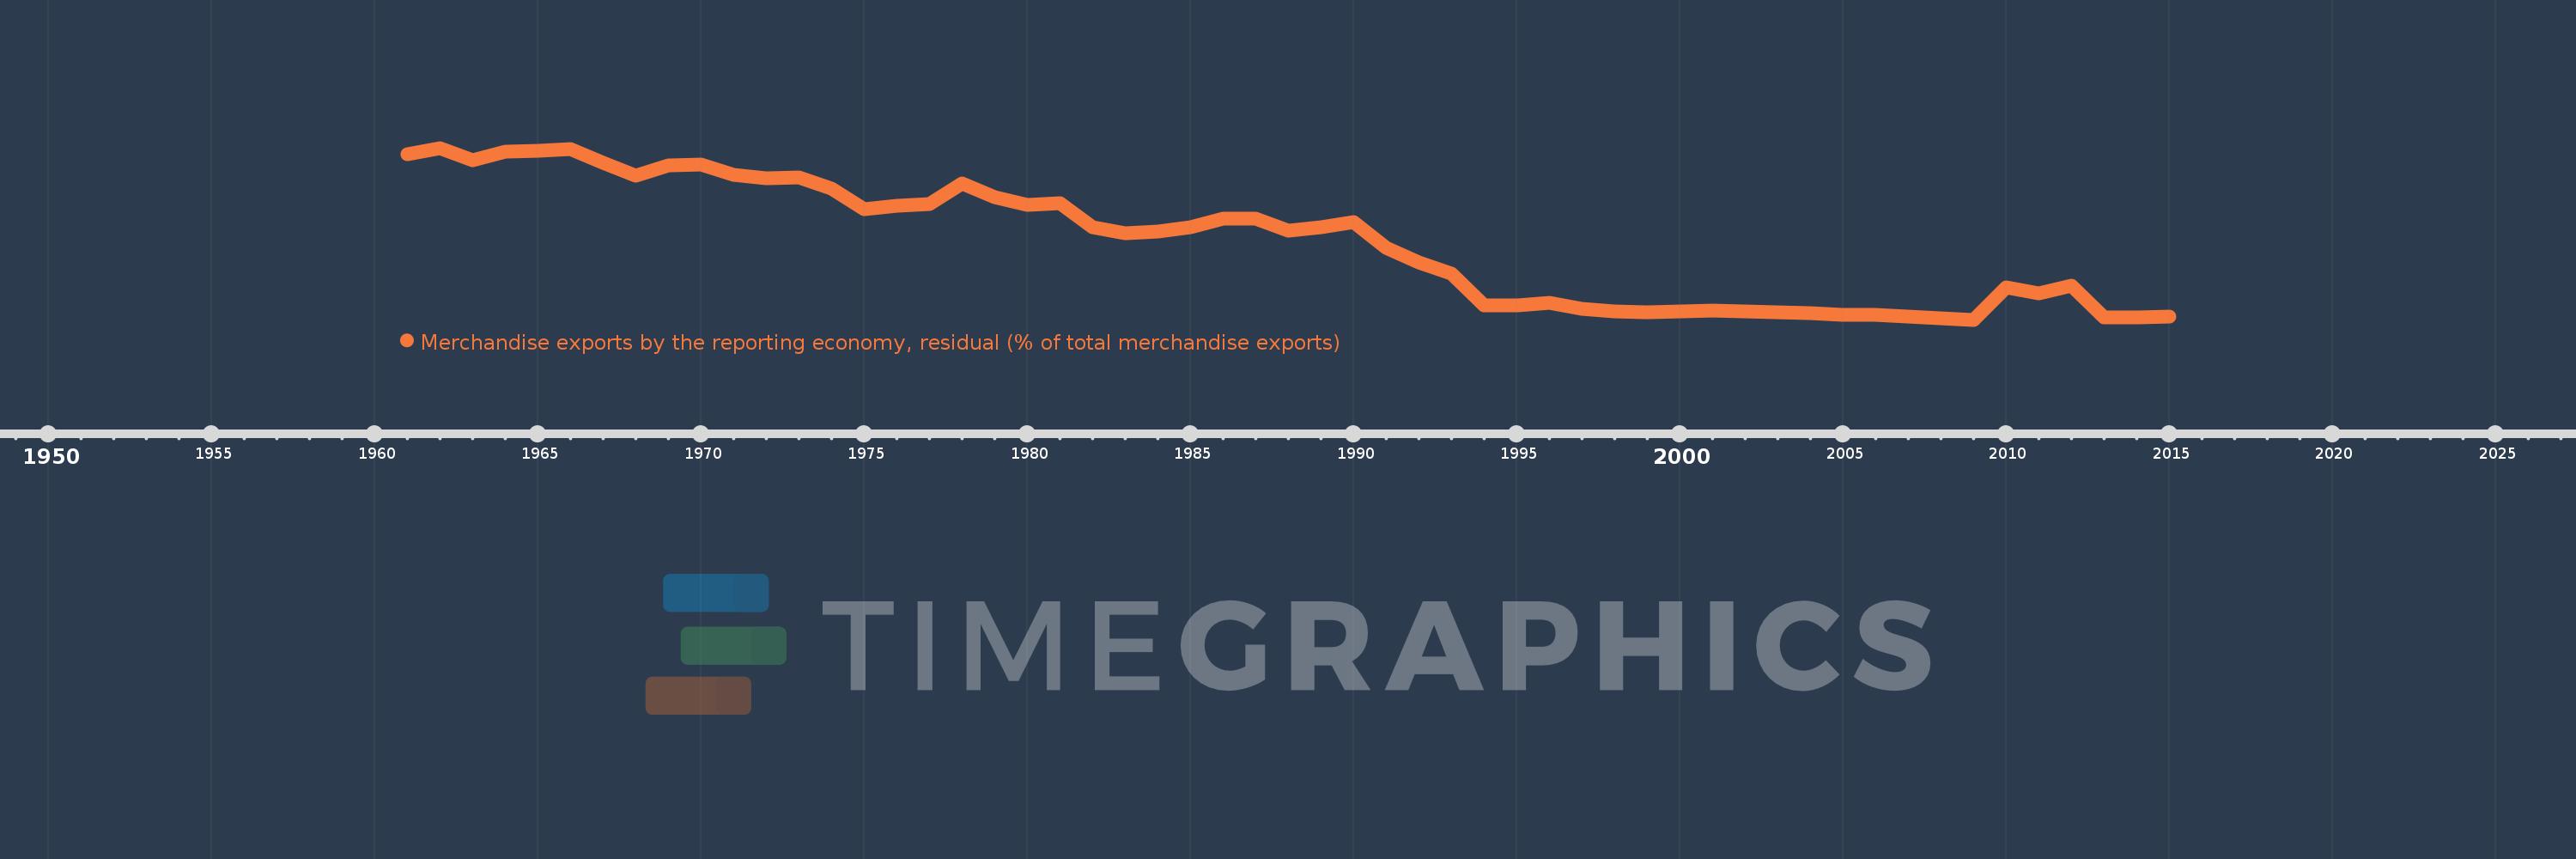
Merchandise exports by the reporting economy, residual (% of total merchandise exports)
2015,2014,2013,2012,2011,2010,2009,2008,2007,2006,2005,2004,2003,2002,2001,2000,1999,1998,1997,1996,1995,1994,1993,1992,1991,1990,1989,1988,1987,1986,1985,1984,1983,1982,1981,1980,1979,1978,1977,1976,1975,1974,1973,1972,1971,1970,1969,1968,1967,1966,1965,1964,1963,1962,1961
This statistics in other country:
AfghanistanAlbaniaAlgeriaAmerican SamoaAngolaAntigua and BarbudaArab WorldArgentinaArmeniaArubaAustraliaAustriaAzerbaijanBahamas, TheBahrainBangladeshBarbadosBelarusBelgiumBelizeBeninBermudaBoliviaBosnia and HerzegovinaBrazilBrunei DarussalamBulgariaBurkina FasoBurundiCabo VerdeCambodiaCameroonCanadaCaribbean small statesCentral African RepublicCentral Europe and the BalticsChadChileChinaColombiaComorosCongo, Dem. Rep.Congo, Rep.Costa RicaCote d'IvoireCroatiaCubaCyprusCzech RepublicDenmarkDjiboutiDominicaDominican RepublicEarly-demographic dividendEast Asia & PacificEast Asia & Pacific (excluding high income)East Asia & Pacific (IDA & IBRD countries)EcuadorEgypt, Arab Rep.El SalvadorEquatorial GuineaEstoniaEthiopiaEuro areaEurope & Central AsiaEurope & Central Asia (excluding high income)Europe & Central Asia (IDA & IBRD countries)European UnionFaroe IslandsFijiFinlandFragile and conflict affected situationsFranceFrench PolynesiaGabonGambia, TheGeorgiaGermanyGhanaGibraltarGreeceGreenlandGrenadaGuamGuatemalaGuineaGuinea-BissauGuyanaHaitiHeavily indebted poor countries (HIPC)High incomeHondurasHong Kong SAR, ChinaHungaryIBRD onlyIcelandIDA & IBRD totalIDA blendIDA onlyIDA totalIndiaIndonesiaIran, Islamic Rep.IraqIrelandIsraelItalyJamaicaJapanJordanKazakhstanKenyaKiribatiKorea, Dem. People’s Rep.Korea, Rep.KosovoKuwaitKyrgyz RepublicLao PDRLate-demographic dividendLatin America & Caribbean Latin America & Caribbean (excluding high income)Latin America & the Caribbean (IDA & IBRD countries)LatviaLeast developed countries: UN classificationLebanonLiberiaLibyaLithuaniaLow & middle incomeLow incomeLower middle incomeLuxembourgMacao SAR, ChinaMacedonia, FYRMadagascarMalawiMalaysiaMaldivesMaliMaltaMauritaniaMauritiusMexicoMiddle East & North AfricaMiddle East & North Africa (excluding high income)Middle East & North Africa (IDA & IBRD countries)Middle incomeMoldovaMongoliaMontenegroMoroccoMozambiqueMyanmarNauruNepalNetherlandsNew CaledoniaNew ZealandNicaraguaNigerNigeriaNorth AmericaNorwayOECD membersOmanOther small statesPacific island small statesPakistanPanamaPapua New GuineaParaguayPeruPhilippinesPolandPortugalPost-demographic dividendPre-demographic dividendQatarRomaniaRussian FederationRwandaSamoaSao Tome and PrincipeSaudi ArabiaSenegalSerbiaSeychellesSierra LeoneSingaporeSlovak RepublicSloveniaSmall statesSolomon IslandsSomaliaSouth AfricaSouth AsiaSouth Asia (IDA & IBRD)SpainSri LankaSt. Kitts and NevisSt. LuciaSt. Vincent and the GrenadinesSub-Saharan Africa Sub-Saharan Africa (excluding high income)Sub-Saharan Africa (IDA & IBRD countries)SudanSurinameSwedenSwitzerlandSyrian Arab RepublicTajikistanTanzaniaThailandTogoTongaTrinidad and TobagoTunisiaTurkeyTurkmenistanTuvaluUgandaUkraineUnited Arab EmiratesUnited KingdomUnited StatesUpper middle incomeUruguayUzbekistanVanuatuVenezuela, RBVietnamWorldYemen, Rep.ZambiaZimbabwe Timeline:
This timeline shows a graph from 1961 to 2015 of Europe & Central Asia (excluding high income). No data until 1960. Number of actual observations by date: 55.
Source name:
World Development Indicators
Source organization:
World Bank staff estimates based data from International Monetary Fund's Direction of Trade database.
Categories, topics:
Private Sector, Trade
Last updated:
apr 23, 2017
Indicators value changes by year
Maximum:
46.733
jan 1, 1962
At the date of observation
Value
Absolute change
Change from previous value
jan 1, 1961
45.085
+45.085
0.0%
jan 1, 1962
46.733
+1.648
3.65%
jan 1, 1963
43.576
-3.156
-6.75%
jan 1, 1964
45.753
+2.177
5.0%
jan 1, 1965
45.869
+0.116
0.25%
jan 1, 1966
46.342
+0.473
1.03%
jan 1, 1967
42.835
-3.507
-7.57%
jan 1, 1968
39.321
-3.515
-8.2%
jan 1, 1969
42.14
+2.819
7.17%
jan 1, 1970
42.29
+0.15
0.36%
jan 1, 1971
39.721
-2.569
-6.07%
jan 1, 1972
38.703
-1.018
-2.56%
jan 1, 1973
38.821
+0.119
0.31%
jan 1, 1974
35.948
-2.874
-7.4%
jan 1, 1975
30.411
-5.537
-15.4%
jan 1, 1976
31.525
+1.114
3.66%
jan 1, 1977
31.862
+0.337
1.07%
jan 1, 1978
37.23
+5.368
16.85%
jan 1, 1979
33.689
-3.54
-9.51%
jan 1, 1980
31.617
-2.073
-6.15%
jan 1, 1981
32.089
+0.472
1.49%
jan 1, 1982
25.791
-6.297
-19.62%
jan 1, 1983
24.117
-1.675
-6.49%
jan 1, 1984
24.534
+0.418
1.73%
jan 1, 1985
25.809
+1.275
5.2%
jan 1, 1986
28.008
+2.199
8.52%
jan 1, 1987
28.021
+0.013
0.05%
jan 1, 1988
24.77
-3.251
-11.6%
jan 1, 1989
25.772
+1.002
4.05%
jan 1, 1990
27.012
+1.24
4.81%
jan 1, 1991
20.325
-6.687
-24.75%
jan 1, 1992
16.367
-3.958
-19.48%
jan 1, 1993
13.538
-2.829
-17.28%
jan 1, 1994
5.136
-8.402
-62.06%
jan 1, 1995
4.967
-0.169
-3.3%
jan 1, 1996
5.697
+0.731
14.71%
jan 1, 1997
4.163
-1.534
-26.93%
jan 1, 1998
3.342
-0.821
-19.71%
jan 1, 1999
3.277
-0.066
-1.96%
jan 1, 2000
3.511
+0.234
7.15%
jan 1, 2001
3.646
+0.135
3.85%
jan 1, 2002
3.347
-0.3
-8.22%
jan 1, 2003
3.148
-0.199
-5.94%
jan 1, 2004
2.927
-0.22
-7.0%
jan 1, 2005
2.55
-0.378
-12.9%
jan 1, 2006
2.471
-0.079
-3.1%
jan 1, 2007
2.128
-0.343
-13.87%
jan 1, 2008
1.707
-0.421
-19.79%
jan 1, 2009
1.229
-0.478
-28.01%
jan 1, 2010
9.75
+8.521
693.51%
jan 1, 2011
8.252
-1.499
-15.37%
jan 1, 2012
10.365
+2.113
25.61%
jan 1, 2013
1.808
-8.556
-82.55%
jan 1, 2014
1.953
+0.145
7.99%
jan 1, 2015
2.033
+0.08
4.09%
Ranking of countries by current statistics by years


Comments: