29
/
en
AIzaSyAYiBZKx7MnpbEhh9jyipgxe19OcubqV5w
April 1, 2024
59991
Sub-Saharan Africa (excluding high income)
SSA
false
2
1
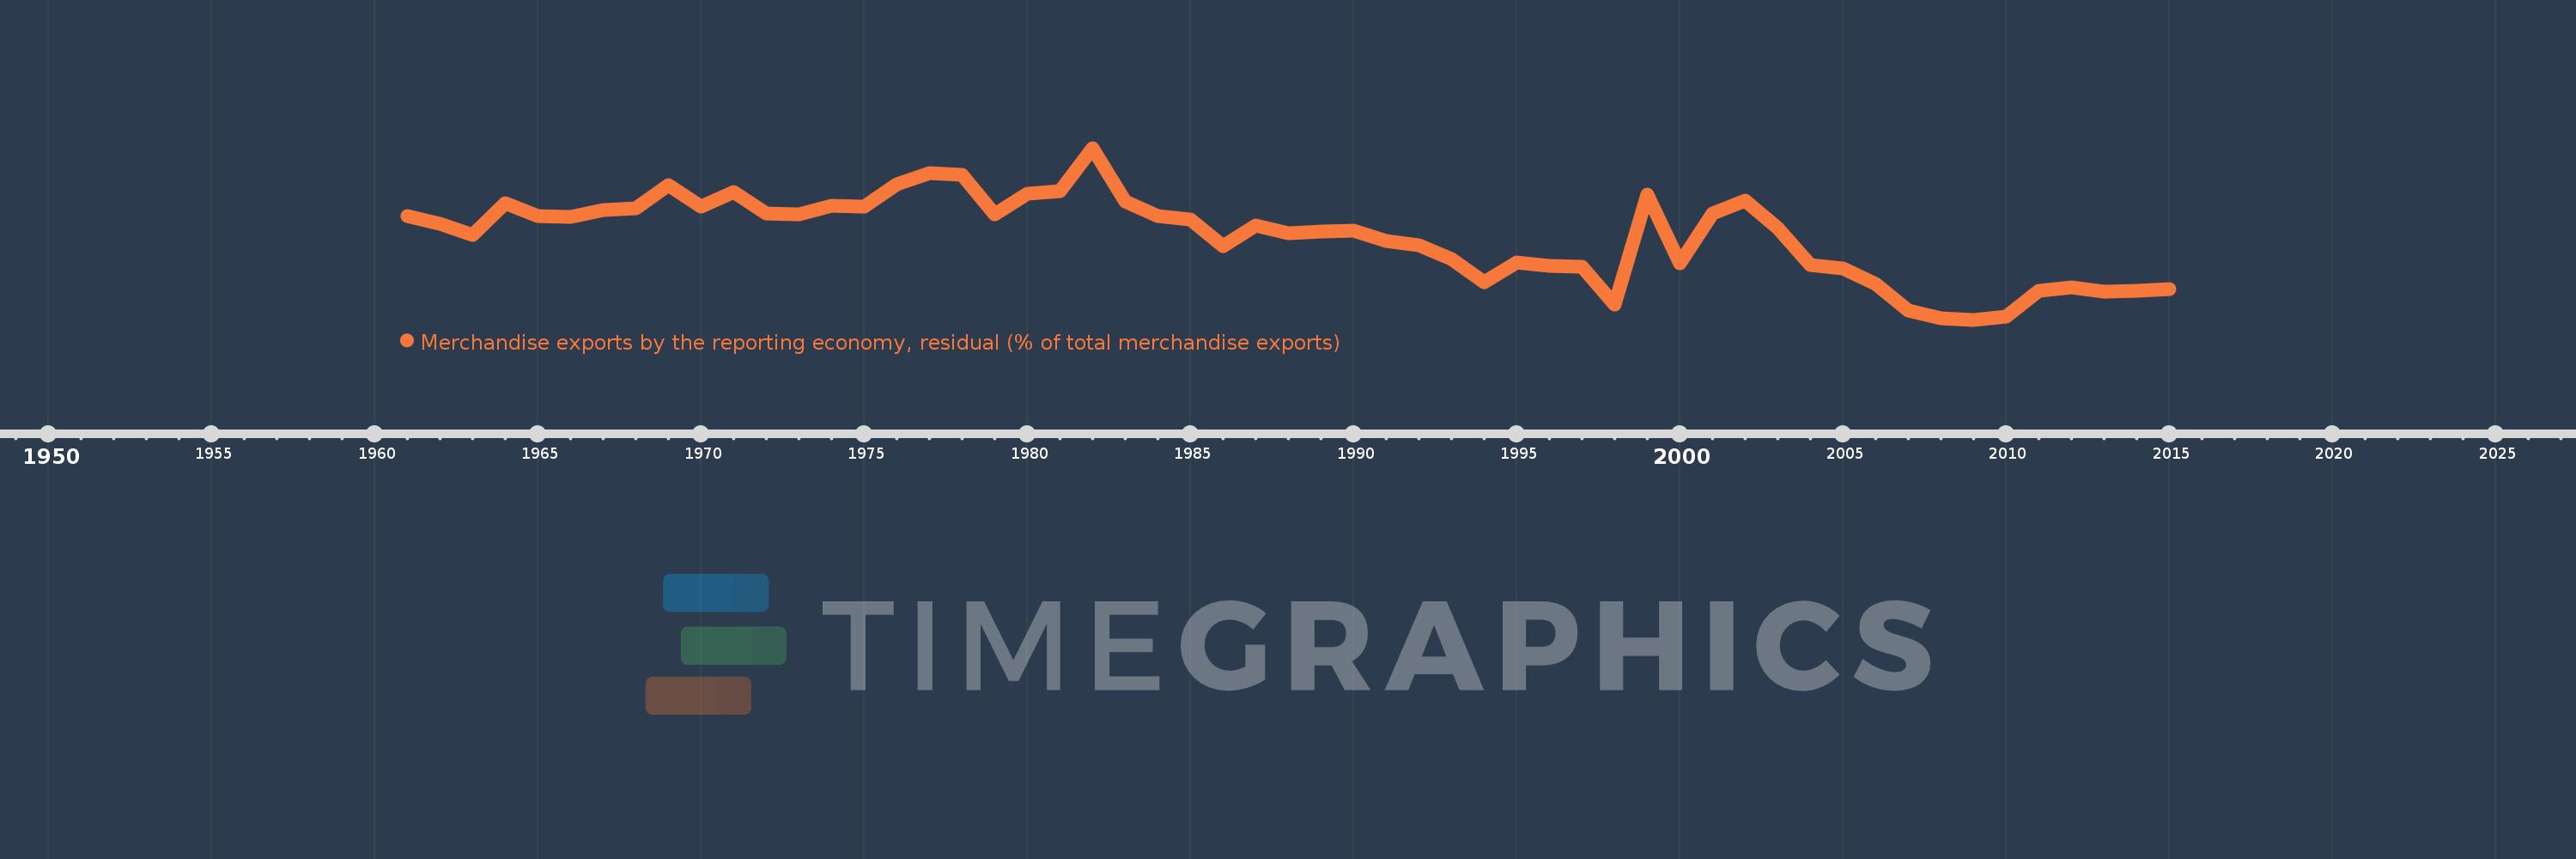
Merchandise exports by the reporting economy, residual (% of total merchandise exports)
2015,2014,2013,2012,2011,2010,2009,2008,2007,2006,2005,2004,2003,2002,2001,2000,1999,1998,1997,1996,1995,1994,1993,1992,1991,1990,1989,1988,1987,1986,1985,1984,1983,1982,1981,1980,1979,1978,1977,1976,1975,1974,1973,1972,1971,1970,1969,1968,1967,1966,1965,1964,1963,1962,1961
This statistics in other country:
AfghanistanAlbaniaAlgeriaAmerican SamoaAngolaAntigua and BarbudaArab WorldArgentinaArmeniaArubaAustraliaAustriaAzerbaijanBahamas, TheBahrainBangladeshBarbadosBelarusBelgiumBelizeBeninBermudaBoliviaBosnia and HerzegovinaBrazilBrunei DarussalamBulgariaBurkina FasoBurundiCabo VerdeCambodiaCameroonCanadaCaribbean small statesCentral African RepublicCentral Europe and the BalticsChadChileChinaColombiaComorosCongo, Dem. Rep.Congo, Rep.Costa RicaCote d'IvoireCroatiaCubaCyprusCzech RepublicDenmarkDjiboutiDominicaDominican RepublicEarly-demographic dividendEast Asia & PacificEast Asia & Pacific (excluding high income)East Asia & Pacific (IDA & IBRD countries)EcuadorEgypt, Arab Rep.El SalvadorEquatorial GuineaEstoniaEthiopiaEuro areaEurope & Central AsiaEurope & Central Asia (excluding high income)Europe & Central Asia (IDA & IBRD countries)European UnionFaroe IslandsFijiFinlandFragile and conflict affected situationsFranceFrench PolynesiaGabonGambia, TheGeorgiaGermanyGhanaGibraltarGreeceGreenlandGrenadaGuamGuatemalaGuineaGuinea-BissauGuyanaHaitiHeavily indebted poor countries (HIPC)High incomeHondurasHong Kong SAR, ChinaHungaryIBRD onlyIcelandIDA & IBRD totalIDA blendIDA onlyIDA totalIndiaIndonesiaIran, Islamic Rep.IraqIrelandIsraelItalyJamaicaJapanJordanKazakhstanKenyaKiribatiKorea, Dem. People’s Rep.Korea, Rep.KosovoKuwaitKyrgyz RepublicLao PDRLate-demographic dividendLatin America & Caribbean Latin America & Caribbean (excluding high income)Latin America & the Caribbean (IDA & IBRD countries)LatviaLeast developed countries: UN classificationLebanonLiberiaLibyaLithuaniaLow & middle incomeLow incomeLower middle incomeLuxembourgMacao SAR, ChinaMacedonia, FYRMadagascarMalawiMalaysiaMaldivesMaliMaltaMauritaniaMauritiusMexicoMiddle East & North AfricaMiddle East & North Africa (excluding high income)Middle East & North Africa (IDA & IBRD countries)Middle incomeMoldovaMongoliaMontenegroMoroccoMozambiqueMyanmarNauruNepalNetherlandsNew CaledoniaNew ZealandNicaraguaNigerNigeriaNorth AmericaNorwayOECD membersOmanOther small statesPacific island small statesPakistanPanamaPapua New GuineaParaguayPeruPhilippinesPolandPortugalPost-demographic dividendPre-demographic dividendQatarRomaniaRussian FederationRwandaSamoaSao Tome and PrincipeSaudi ArabiaSenegalSerbiaSeychellesSierra LeoneSingaporeSlovak RepublicSloveniaSmall statesSolomon IslandsSomaliaSouth AfricaSouth AsiaSouth Asia (IDA & IBRD)SpainSri LankaSt. Kitts and NevisSt. LuciaSt. Vincent and the GrenadinesSub-Saharan Africa Sub-Saharan Africa (excluding high income)Sub-Saharan Africa (IDA & IBRD countries)SudanSurinameSwedenSwitzerlandSyrian Arab RepublicTajikistanTanzaniaThailandTogoTongaTrinidad and TobagoTunisiaTurkeyTurkmenistanTuvaluUgandaUkraineUnited Arab EmiratesUnited KingdomUnited StatesUpper middle incomeUruguayUzbekistanVanuatuVenezuela, RBVietnamWorldYemen, Rep.ZambiaZimbabwe Timeline:
This timeline shows a graph from 1961 to 2015 of Sub-Saharan Africa (excluding high income). No data until 1960. Number of actual observations by date: 55.
Source name:
World Development Indicators
Source organization:
World Bank staff estimates based data from International Monetary Fund's Direction of Trade database.
Categories, topics:
Private Sector, Trade
Last updated:
apr 23, 2017
Indicators value changes by year
Maximum:
17.788
jan 1, 1982
At the date of observation
Value
Absolute change
Change from previous value
jan 1, 1961
11.597
+11.597
0.0%
jan 1, 1962
10.867
-0.73
-6.29%
jan 1, 1963
9.849
-1.019
-9.37%
jan 1, 1964
12.745
+2.896
29.41%
jan 1, 1965
11.59
-1.154
-9.06%
jan 1, 1966
11.537
-0.054
-0.46%
jan 1, 1967
12.11
+0.573
4.97%
jan 1, 1968
12.26
+0.149
1.23%
jan 1, 1969
14.429
+2.169
17.7%
jan 1, 1970
12.448
-1.981
-13.73%
jan 1, 1971
13.811
+1.363
10.95%
jan 1, 1972
11.792
-2.019
-14.62%
jan 1, 1973
11.742
-0.049
-0.42%
jan 1, 1974
12.545
+0.802
6.83%
jan 1, 1975
12.429
-0.115
-0.92%
jan 1, 1976
14.465
+2.036
16.38%
jan 1, 1977
15.516
+1.052
7.27%
jan 1, 1978
15.309
-0.208
-1.34%
jan 1, 1979
11.715
-3.593
-23.47%
jan 1, 1980
13.618
+1.903
16.24%
jan 1, 1981
13.84
+0.221
1.62%
jan 1, 1982
17.788
+3.948
28.53%
jan 1, 1983
12.943
-4.844
-27.23%
jan 1, 1984
11.595
-1.348
-10.41%
jan 1, 1985
11.237
-0.358
-3.09%
jan 1, 1986
8.815
-2.422
-21.56%
jan 1, 1987
10.755
+1.94
22.01%
jan 1, 1988
10.033
-0.722
-6.72%
jan 1, 1989
10.21
+0.177
1.77%
jan 1, 1990
10.23
+0.02
0.2%
jan 1, 1991
9.35
-0.88
-8.61%
jan 1, 1992
8.891
-0.459
-4.91%
jan 1, 1993
7.688
-1.203
-13.53%
jan 1, 1994
5.538
-2.15
-27.97%
jan 1, 1995
7.356
+1.819
32.84%
jan 1, 1996
7.06
-0.296
-4.03%
jan 1, 1997
6.968
-0.091
-1.3%
jan 1, 1998
3.545
-3.424
-49.13%
jan 1, 1999
13.574
+10.029
282.93%
jan 1, 2000
7.243
-6.33
-46.64%
jan 1, 2001
11.839
+4.596
63.45%
jan 1, 2002
12.996
+1.157
9.77%
jan 1, 2003
10.522
-2.474
-19.04%
jan 1, 2004
7.089
-3.434
-32.63%
jan 1, 2005
6.798
-0.291
-4.1%
jan 1, 2006
5.38
-1.418
-20.85%
jan 1, 2007
2.944
-2.437
-45.29%
jan 1, 2008
2.298
-0.646
-21.93%
jan 1, 2009
2.135
-0.163
-7.11%
jan 1, 2010
2.461
+0.326
15.29%
jan 1, 2011
4.803
+2.342
95.15%
jan 1, 2012
5.068
+0.265
5.52%
jan 1, 2013
4.665
-0.403
-7.96%
jan 1, 2014
4.794
+0.129
2.78%
jan 1, 2015
4.891
+0.097
2.01%
Ranking of countries by current statistics by years


Comments: