29
/
en
AIzaSyAYiBZKx7MnpbEhh9jyipgxe19OcubqV5w
April 1, 2024
79684
Barbados
BRB
true
2
1
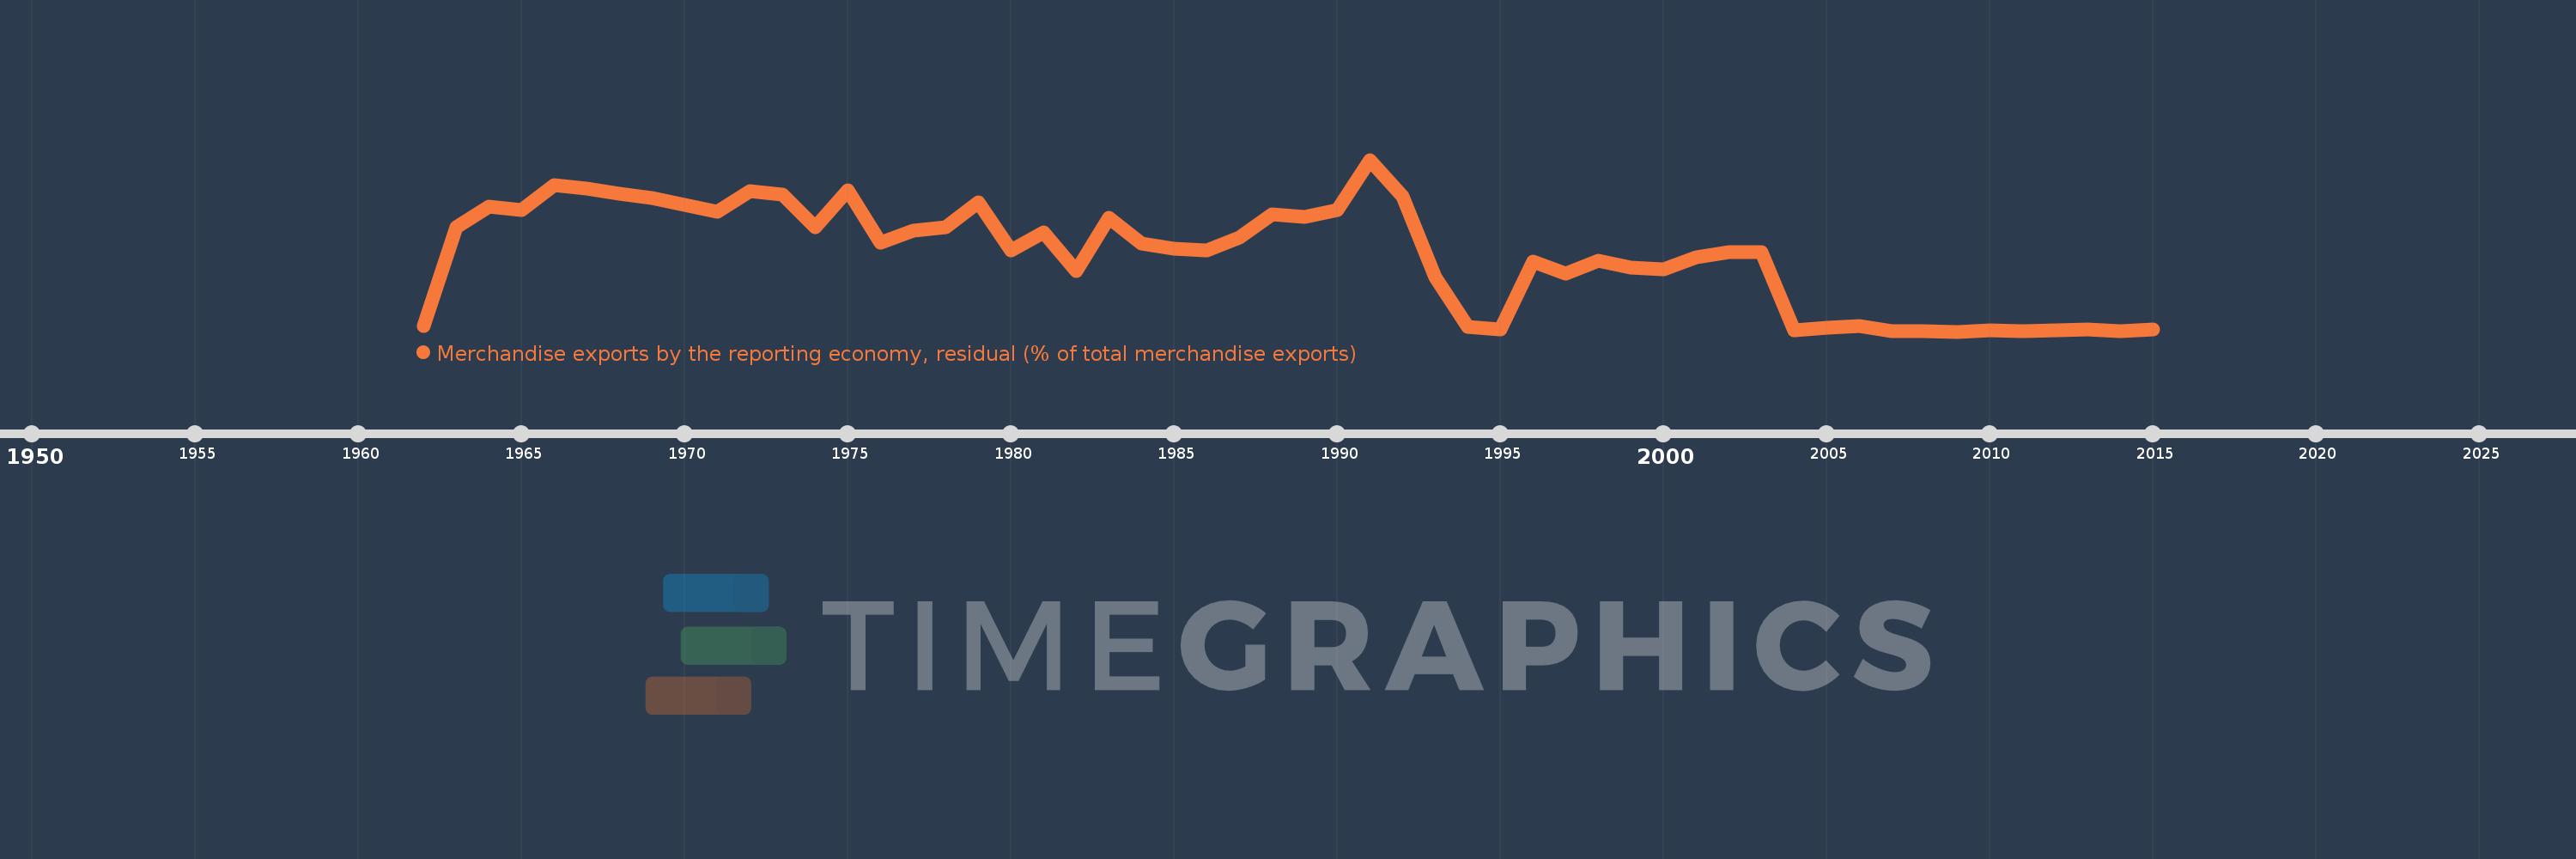
Merchandise exports by the reporting economy, residual (% of total merchandise exports)
2015,2014,2013,2012,2011,2010,2009,2008,2007,2006,2005,2004,2003,2002,2001,2000,1999,1998,1997,1996,1995,1994,1993,1992,1991,1990,1989,1988,1987,1986,1985,1984,1983,1982,1981,1980,1979,1978,1977,1976,1975,1974,1973,1972,1971,1969,1968,1967,1966,1965,1964,1963,1962
This statistics in other country:
AfghanistanAlbaniaAlgeriaAmerican SamoaAngolaAntigua and BarbudaArab WorldArgentinaArmeniaArubaAustraliaAustriaAzerbaijanBahamas, TheBahrainBangladeshBarbadosBelarusBelgiumBelizeBeninBermudaBoliviaBosnia and HerzegovinaBrazilBrunei DarussalamBulgariaBurkina FasoBurundiCabo VerdeCambodiaCameroonCanadaCaribbean small statesCentral African RepublicCentral Europe and the BalticsChadChileChinaColombiaComorosCongo, Dem. Rep.Congo, Rep.Costa RicaCote d'IvoireCroatiaCubaCyprusCzech RepublicDenmarkDjiboutiDominicaDominican RepublicEarly-demographic dividendEast Asia & PacificEast Asia & Pacific (excluding high income)East Asia & Pacific (IDA & IBRD countries)EcuadorEgypt, Arab Rep.El SalvadorEquatorial GuineaEstoniaEthiopiaEuro areaEurope & Central AsiaEurope & Central Asia (excluding high income)Europe & Central Asia (IDA & IBRD countries)European UnionFaroe IslandsFijiFinlandFragile and conflict affected situationsFranceFrench PolynesiaGabonGambia, TheGeorgiaGermanyGhanaGibraltarGreeceGreenlandGrenadaGuamGuatemalaGuineaGuinea-BissauGuyanaHaitiHeavily indebted poor countries (HIPC)High incomeHondurasHong Kong SAR, ChinaHungaryIBRD onlyIcelandIDA & IBRD totalIDA blendIDA onlyIDA totalIndiaIndonesiaIran, Islamic Rep.IraqIrelandIsraelItalyJamaicaJapanJordanKazakhstanKenyaKiribatiKorea, Dem. People’s Rep.Korea, Rep.KosovoKuwaitKyrgyz RepublicLao PDRLate-demographic dividendLatin America & Caribbean Latin America & Caribbean (excluding high income)Latin America & the Caribbean (IDA & IBRD countries)LatviaLeast developed countries: UN classificationLebanonLiberiaLibyaLithuaniaLow & middle incomeLow incomeLower middle incomeLuxembourgMacao SAR, ChinaMacedonia, FYRMadagascarMalawiMalaysiaMaldivesMaliMaltaMauritaniaMauritiusMexicoMiddle East & North AfricaMiddle East & North Africa (excluding high income)Middle East & North Africa (IDA & IBRD countries)Middle incomeMoldovaMongoliaMontenegroMoroccoMozambiqueMyanmarNauruNepalNetherlandsNew CaledoniaNew ZealandNicaraguaNigerNigeriaNorth AmericaNorwayOECD membersOmanOther small statesPacific island small statesPakistanPanamaPapua New GuineaParaguayPeruPhilippinesPolandPortugalPost-demographic dividendPre-demographic dividendQatarRomaniaRussian FederationRwandaSamoaSao Tome and PrincipeSaudi ArabiaSenegalSerbiaSeychellesSierra LeoneSingaporeSlovak RepublicSloveniaSmall statesSolomon IslandsSomaliaSouth AfricaSouth AsiaSouth Asia (IDA & IBRD)SpainSri LankaSt. Kitts and NevisSt. LuciaSt. Vincent and the GrenadinesSub-Saharan Africa Sub-Saharan Africa (excluding high income)Sub-Saharan Africa (IDA & IBRD countries)SudanSurinameSwedenSwitzerlandSyrian Arab RepublicTajikistanTanzaniaThailandTogoTongaTrinidad and TobagoTunisiaTurkeyTurkmenistanTuvaluUgandaUkraineUnited Arab EmiratesUnited KingdomUnited StatesUpper middle incomeUruguayUzbekistanVanuatuVenezuela, RBVietnamWorldYemen, Rep.ZambiaZimbabwe Timeline:
This timeline shows a graph from 1962 to 2015 of Barbados. No data until 1961. Number of actual observations by date: 53.
Source name:
World Development Indicators
Source organization:
World Bank staff estimates based data from International Monetary Fund's Direction of Trade database.
Categories, topics:
Private Sector, Trade
Last updated:
apr 23, 2017
Indicators value changes by year
Maximum:
39.494
jan 1, 1991
At the date of observation
Value
Absolute change
Change from previous value
jan 1, 1963
24.521
+21.721
775.75%
jan 1, 1964
29.167
+4.646
18.95%
jan 1, 1965
28.409
-0.758
-2.6%
jan 1, 1966
33.867
+5.458
19.21%
jan 1, 1967
33.1
-0.766
-2.26%
jan 1, 1968
32.05
-1.051
-3.17%
jan 1, 1969
31.148
-0.902
-2.81%
jan 1, 1971
28.05
-3.097
-9.94%
jan 1, 1972
32.659
+4.609
16.43%
jan 1, 1973
31.754
-0.905
-2.77%
jan 1, 1974
24.582
-7.172
-22.59%
jan 1, 1975
32.776
+8.195
33.34%
jan 1, 1976
21.211
-11.566
-35.29%
jan 1, 1977
23.801
+2.59
12.21%
jan 1, 1978
24.699
+0.899
3.78%
jan 1, 1979
30.136
+5.437
22.01%
jan 1, 1980
19.57
-10.566
-35.06%
jan 1, 1981
23.564
+3.994
20.41%
jan 1, 1982
14.881
-8.683
-36.85%
jan 1, 1983
26.685
+11.804
79.32%
jan 1, 1984
21.072
-5.613
-21.03%
jan 1, 1985
19.817
-1.255
-5.96%
jan 1, 1986
19.588
-0.229
-1.16%
jan 1, 1987
22.252
+2.665
13.6%
jan 1, 1988
27.537
+5.285
23.75%
jan 1, 1989
26.902
-0.635
-2.31%
jan 1, 1990
28.498
+1.596
5.93%
jan 1, 1991
39.494
+10.996
38.59%
jan 1, 1992
31.514
-7.981
-20.21%
jan 1, 1993
13.657
-17.857
-56.66%
jan 1, 1994
2.547
-11.11
-81.35%
jan 1, 1995
2.076
-0.471
-18.48%
jan 1, 1996
16.967
+14.89
717.23%
jan 1, 1997
14.388
-2.579
-15.2%
jan 1, 1998
17.148
+2.76
19.18%
jan 1, 1999
15.66
-1.488
-8.68%
jan 1, 2000
15.314
-0.346
-2.21%
jan 1, 2001
17.92
+2.606
17.02%
jan 1, 2002
19.15
+1.23
6.86%
jan 1, 2003
19.029
-0.121
-0.63%
jan 1, 2004
1.921
-17.107
-89.9%
jan 1, 2005
2.405
+0.484
25.18%
jan 1, 2006
2.868
+0.463
19.24%
jan 1, 2007
1.74
-1.128
-39.32%
jan 1, 2008
1.632
-0.108
-6.21%
jan 1, 2009
1.578
-0.054
-3.31%
jan 1, 2010
1.926
+0.348
22.02%
jan 1, 2011
1.732
-0.194
-10.07%
jan 1, 2012
1.771
+0.04
2.3%
jan 1, 2013
2.031
+0.26
14.68%
jan 1, 2014
1.733
-0.298
-14.68%
jan 1, 2015
2.029
+0.296
17.07%
Ranking of countries by current statistics by years


Comments: