29
/
en
AIzaSyAYiBZKx7MnpbEhh9jyipgxe19OcubqV5w
April 1, 2024
135782
Gabon
GAB
true
2
1
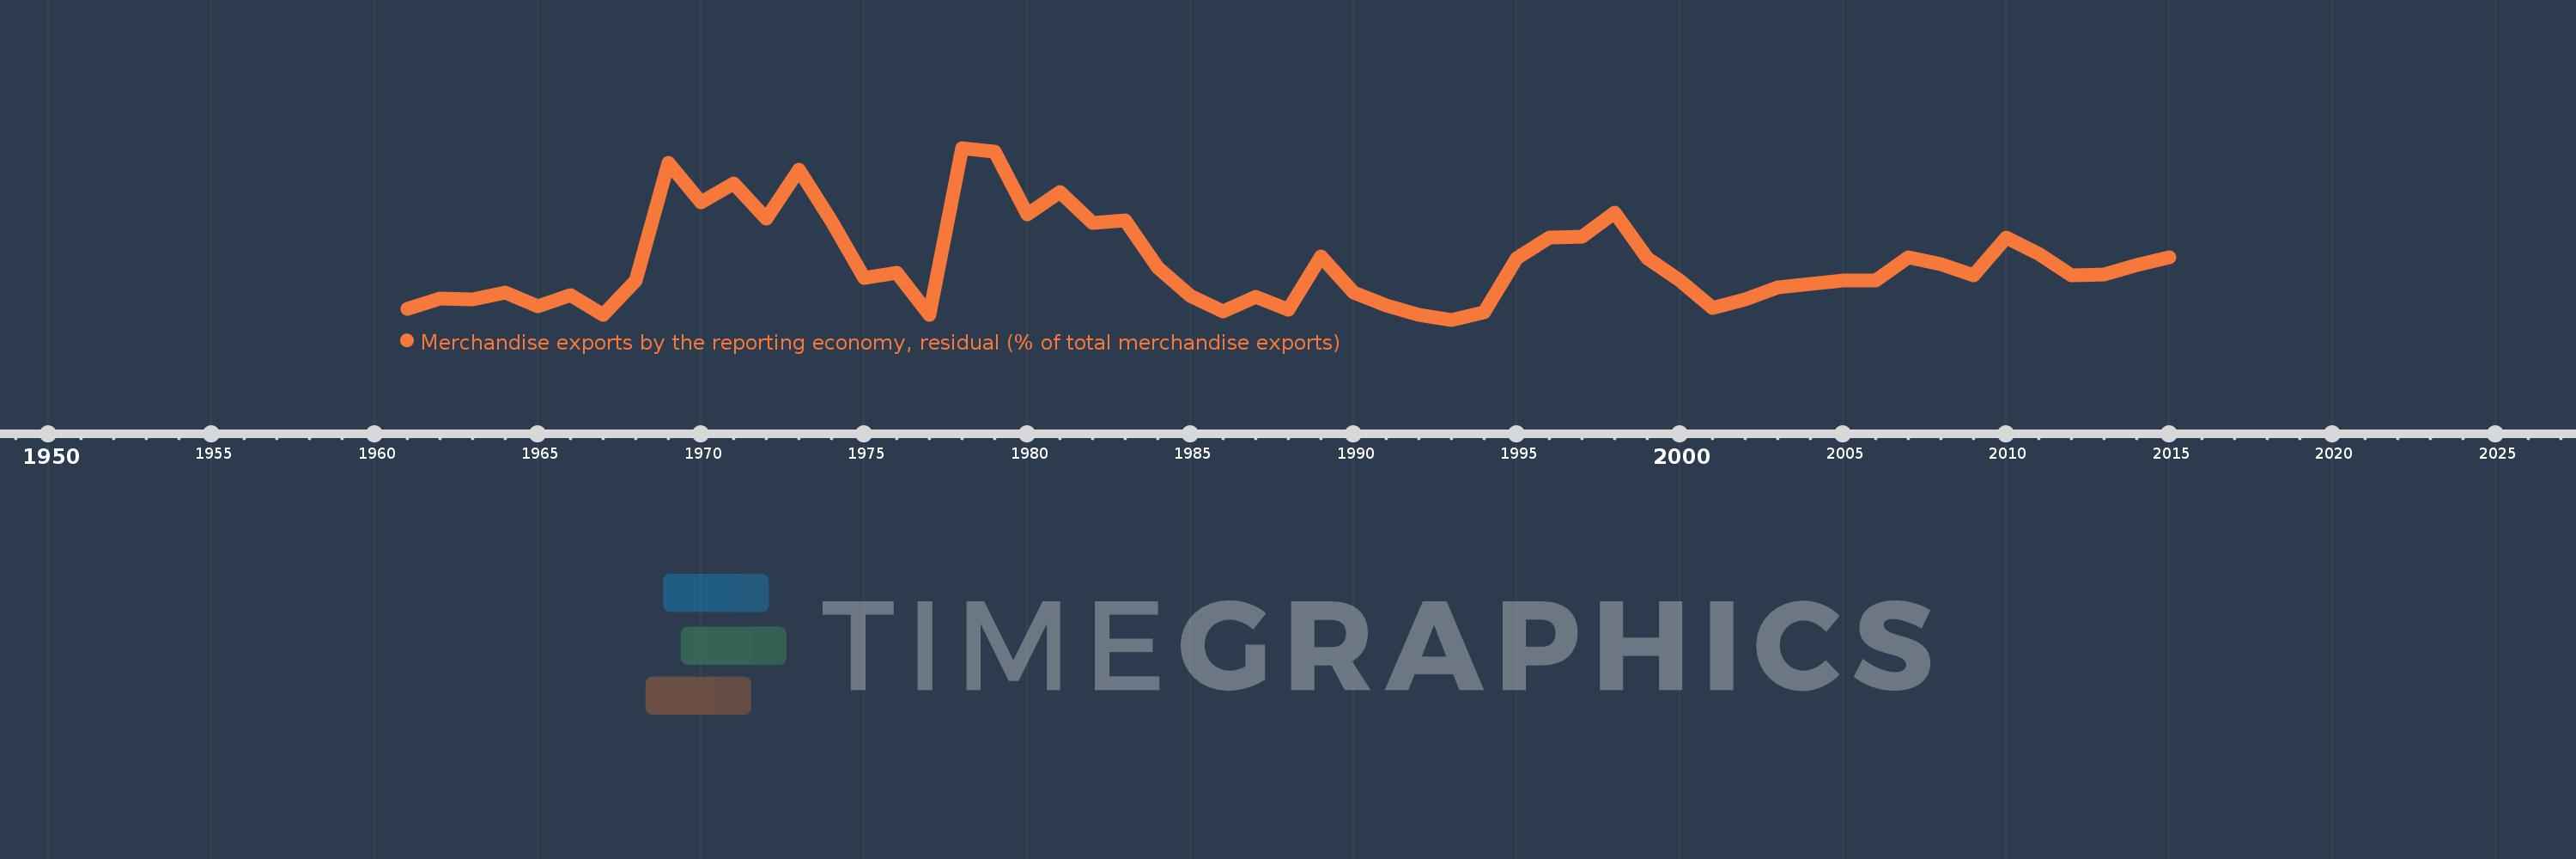
Merchandise exports by the reporting economy, residual (% of total merchandise exports)
2015,2014,2013,2012,2011,2010,2009,2008,2007,2006,2005,2004,2003,2002,2001,2000,1999,1998,1997,1996,1995,1994,1993,1992,1991,1990,1989,1988,1987,1986,1985,1984,1983,1982,1981,1980,1979,1978,1977,1976,1975,1974,1973,1972,1971,1970,1969,1968,1967,1966,1965,1964,1963,1962,1961
This statistics in other country:
AfghanistanAlbaniaAlgeriaAmerican SamoaAngolaAntigua and BarbudaArab WorldArgentinaArmeniaArubaAustraliaAustriaAzerbaijanBahamas, TheBahrainBangladeshBarbadosBelarusBelgiumBelizeBeninBermudaBoliviaBosnia and HerzegovinaBrazilBrunei DarussalamBulgariaBurkina FasoBurundiCabo VerdeCambodiaCameroonCanadaCaribbean small statesCentral African RepublicCentral Europe and the BalticsChadChileChinaColombiaComorosCongo, Dem. Rep.Congo, Rep.Costa RicaCote d'IvoireCroatiaCubaCyprusCzech RepublicDenmarkDjiboutiDominicaDominican RepublicEarly-demographic dividendEast Asia & PacificEast Asia & Pacific (excluding high income)East Asia & Pacific (IDA & IBRD countries)EcuadorEgypt, Arab Rep.El SalvadorEquatorial GuineaEstoniaEthiopiaEuro areaEurope & Central AsiaEurope & Central Asia (excluding high income)Europe & Central Asia (IDA & IBRD countries)European UnionFaroe IslandsFijiFinlandFragile and conflict affected situationsFranceFrench PolynesiaGabonGambia, TheGeorgiaGermanyGhanaGibraltarGreeceGreenlandGrenadaGuamGuatemalaGuineaGuinea-BissauGuyanaHaitiHeavily indebted poor countries (HIPC)High incomeHondurasHong Kong SAR, ChinaHungaryIBRD onlyIcelandIDA & IBRD totalIDA blendIDA onlyIDA totalIndiaIndonesiaIran, Islamic Rep.IraqIrelandIsraelItalyJamaicaJapanJordanKazakhstanKenyaKiribatiKorea, Dem. People’s Rep.Korea, Rep.KosovoKuwaitKyrgyz RepublicLao PDRLate-demographic dividendLatin America & Caribbean Latin America & Caribbean (excluding high income)Latin America & the Caribbean (IDA & IBRD countries)LatviaLeast developed countries: UN classificationLebanonLiberiaLibyaLithuaniaLow & middle incomeLow incomeLower middle incomeLuxembourgMacao SAR, ChinaMacedonia, FYRMadagascarMalawiMalaysiaMaldivesMaliMaltaMauritaniaMauritiusMexicoMiddle East & North AfricaMiddle East & North Africa (excluding high income)Middle East & North Africa (IDA & IBRD countries)Middle incomeMoldovaMongoliaMontenegroMoroccoMozambiqueMyanmarNauruNepalNetherlandsNew CaledoniaNew ZealandNicaraguaNigerNigeriaNorth AmericaNorwayOECD membersOmanOther small statesPacific island small statesPakistanPanamaPapua New GuineaParaguayPeruPhilippinesPolandPortugalPost-demographic dividendPre-demographic dividendQatarRomaniaRussian FederationRwandaSamoaSao Tome and PrincipeSaudi ArabiaSenegalSerbiaSeychellesSierra LeoneSingaporeSlovak RepublicSloveniaSmall statesSolomon IslandsSomaliaSouth AfricaSouth AsiaSouth Asia (IDA & IBRD)SpainSri LankaSt. Kitts and NevisSt. LuciaSt. Vincent and the GrenadinesSub-Saharan Africa Sub-Saharan Africa (excluding high income)Sub-Saharan Africa (IDA & IBRD countries)SudanSurinameSwedenSwitzerlandSyrian Arab RepublicTajikistanTanzaniaThailandTogoTongaTrinidad and TobagoTunisiaTurkeyTurkmenistanTuvaluUgandaUkraineUnited Arab EmiratesUnited KingdomUnited StatesUpper middle incomeUruguayUzbekistanVanuatuVenezuela, RBVietnamWorldYemen, Rep.ZambiaZimbabwe Timeline:
This timeline shows a graph from 1961 to 2015 of Gabon. No data until 1960. Number of actual observations by date: 55.
Source name:
World Development Indicators
Source organization:
World Bank staff estimates based data from International Monetary Fund's Direction of Trade database.
Categories, topics:
Private Sector, Trade
Last updated:
apr 23, 2017
Indicators value changes by year
Maximum:
28.903
jan 1, 1978
At the date of observation
Value
Absolute change
Change from previous value
jan 1, 1961
5.858
+5.858
0.0%
jan 1, 1962
7.246
+1.389
23.71%
jan 1, 1963
7.167
-0.079
-1.09%
jan 1, 1964
8.174
+1.007
14.05%
jan 1, 1965
6.125
-2.05
-25.08%
jan 1, 1966
7.81
+1.685
27.51%
jan 1, 1967
4.965
-2.844
-36.42%
jan 1, 1968
9.842
+4.876
98.21%
jan 1, 1969
26.814
+16.972
172.46%
jan 1, 1970
21.062
-5.752
-21.45%
jan 1, 1971
23.847
+2.785
13.22%
jan 1, 1972
18.776
-5.071
-21.26%
jan 1, 1973
25.776
+7.0
37.28%
jan 1, 1974
18.417
-7.359
-28.55%
jan 1, 1975
10.268
-8.149
-44.25%
jan 1, 1976
11.032
+0.765
7.45%
jan 1, 1977
4.901
-6.131
-55.58%
jan 1, 1978
28.903
+24.002
489.75%
jan 1, 1979
28.392
-0.511
-1.77%
jan 1, 1980
19.424
-8.968
-31.59%
jan 1, 1981
22.529
+3.106
15.99%
jan 1, 1982
18.154
-4.375
-19.42%
jan 1, 1983
18.511
+0.357
1.96%
jan 1, 1984
11.768
-6.743
-36.43%
jan 1, 1985
7.639
-4.129
-35.08%
jan 1, 1986
5.422
-2.218
-29.03%
jan 1, 1987
7.535
+2.113
38.98%
jan 1, 1988
5.704
-1.831
-24.3%
jan 1, 1989
13.396
+7.692
134.85%
jan 1, 1990
8.2
-5.196
-38.79%
jan 1, 1991
6.248
-1.952
-23.81%
jan 1, 1992
4.959
-1.289
-20.64%
jan 1, 1993
4.251
-0.707
-14.27%
jan 1, 1994
5.346
+1.095
25.76%
jan 1, 1995
13.083
+7.736
144.7%
jan 1, 1996
16.045
+2.963
22.65%
jan 1, 1997
16.179
+0.133
0.83%
jan 1, 1998
19.639
+3.461
21.39%
jan 1, 1999
13.119
-6.521
-33.2%
jan 1, 2000
9.828
-3.291
-25.09%
jan 1, 2001
5.899
-3.928
-39.97%
jan 1, 2002
7.134
+1.235
20.94%
jan 1, 2003
8.935
+1.801
25.24%
jan 1, 2004
9.342
+0.408
4.56%
jan 1, 2005
9.927
+0.585
6.26%
jan 1, 2006
9.869
-0.058
-0.58%
jan 1, 2007
13.239
+3.37
34.15%
jan 1, 2008
12.169
-1.07
-8.08%
jan 1, 2009
10.633
-1.536
-12.62%
jan 1, 2010
16.085
+5.451
51.27%
jan 1, 2011
13.739
-2.345
-14.58%
jan 1, 2012
10.584
-3.155
-22.96%
jan 1, 2013
10.786
+0.202
1.91%
jan 1, 2014
12.102
+1.316
12.2%
jan 1, 2015
13.261
+1.159
9.58%
Ranking of countries by current statistics by years


Comments: