29
/
en
AIzaSyAYiBZKx7MnpbEhh9jyipgxe19OcubqV5w
April 1, 2024
119152
Denmark
DNK
true
2
1
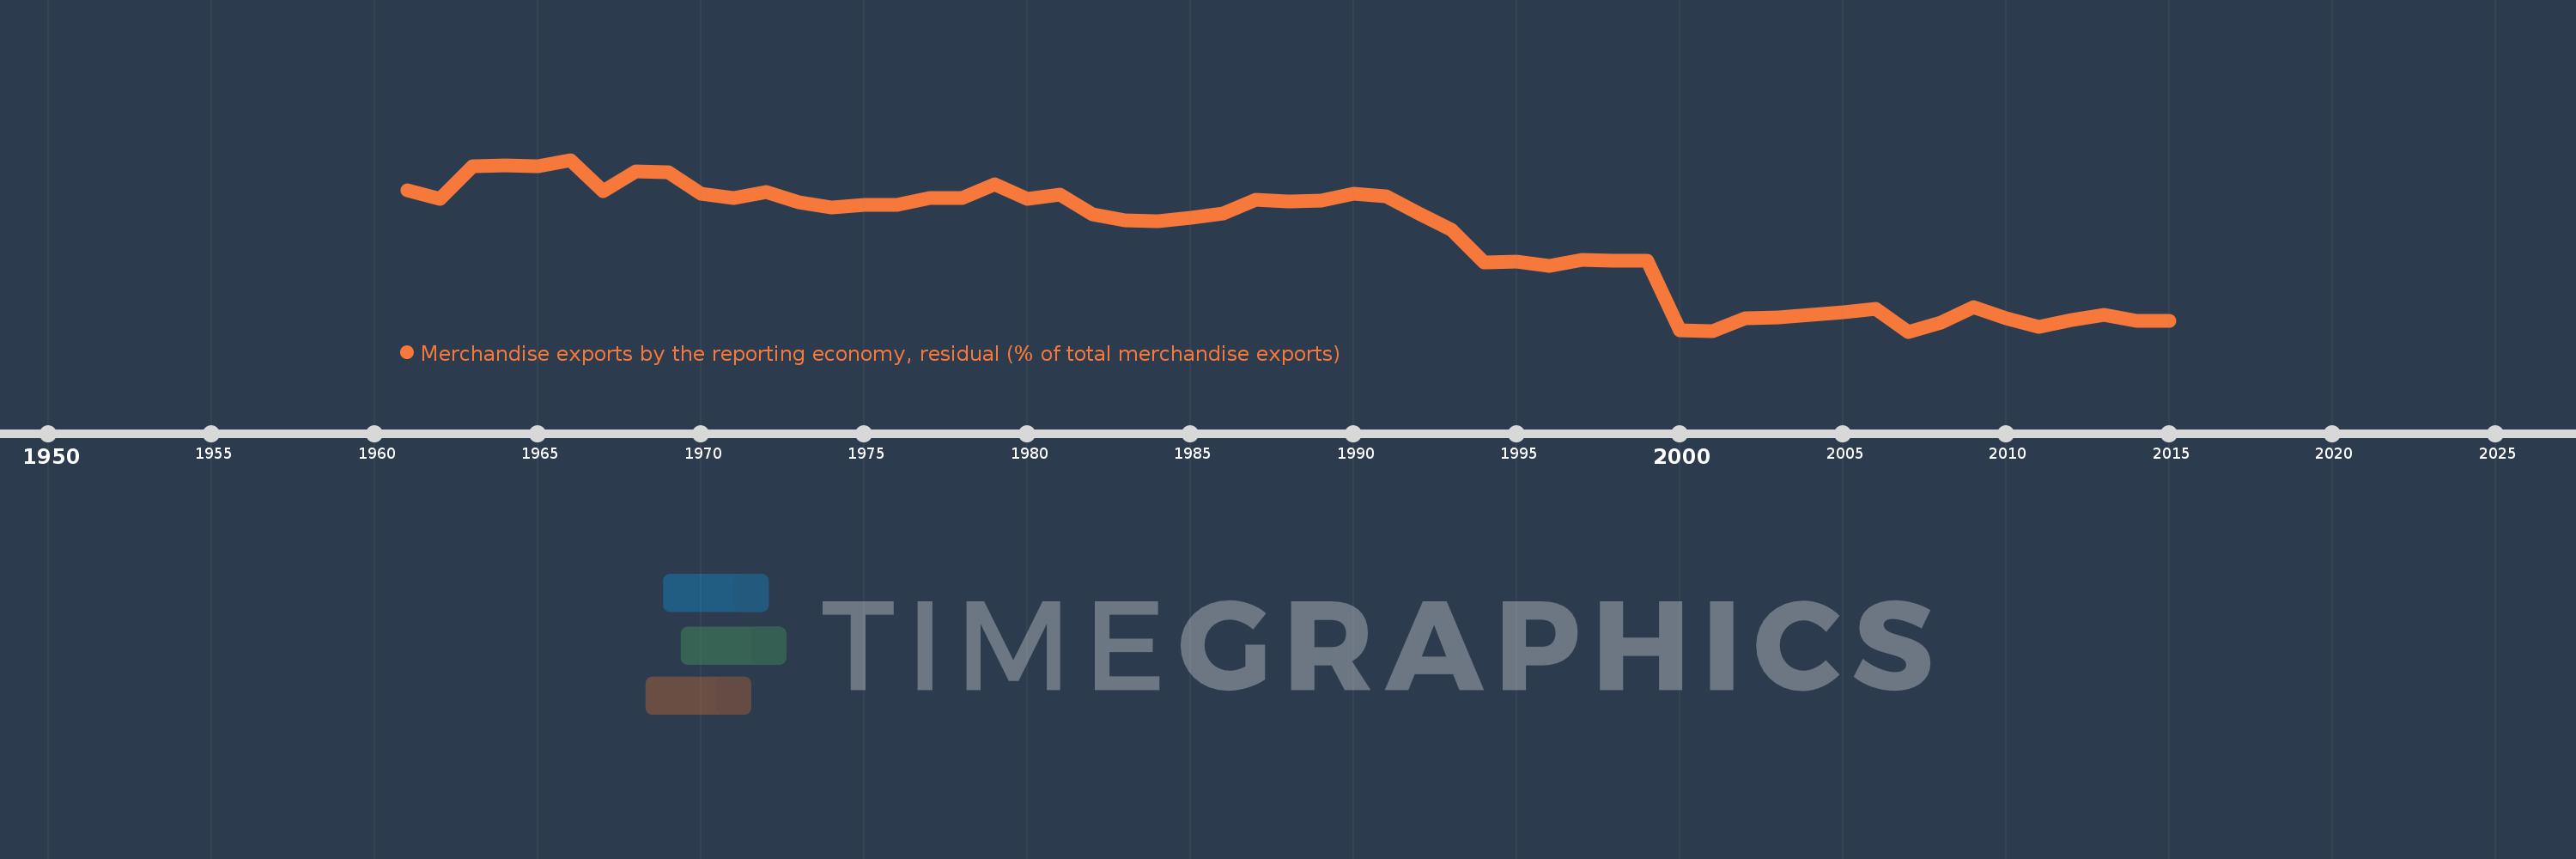
Merchandise exports by the reporting economy, residual (% of total merchandise exports)
2015,2014,2013,2012,2011,2010,2009,2008,2007,2006,2005,2004,2003,2002,2001,2000,1999,1998,1997,1996,1995,1994,1993,1992,1991,1990,1989,1988,1987,1986,1985,1984,1983,1982,1981,1980,1979,1978,1977,1976,1975,1974,1973,1972,1971,1970,1969,1968,1967,1966,1965,1964,1963,1962,1961
This statistics in other country:
AfghanistanAlbaniaAlgeriaAmerican SamoaAngolaAntigua and BarbudaArab WorldArgentinaArmeniaArubaAustraliaAustriaAzerbaijanBahamas, TheBahrainBangladeshBarbadosBelarusBelgiumBelizeBeninBermudaBoliviaBosnia and HerzegovinaBrazilBrunei DarussalamBulgariaBurkina FasoBurundiCabo VerdeCambodiaCameroonCanadaCaribbean small statesCentral African RepublicCentral Europe and the BalticsChadChileChinaColombiaComorosCongo, Dem. Rep.Congo, Rep.Costa RicaCote d'IvoireCroatiaCubaCyprusCzech RepublicDenmarkDjiboutiDominicaDominican RepublicEarly-demographic dividendEast Asia & PacificEast Asia & Pacific (excluding high income)East Asia & Pacific (IDA & IBRD countries)EcuadorEgypt, Arab Rep.El SalvadorEquatorial GuineaEstoniaEthiopiaEuro areaEurope & Central AsiaEurope & Central Asia (excluding high income)Europe & Central Asia (IDA & IBRD countries)European UnionFaroe IslandsFijiFinlandFragile and conflict affected situationsFranceFrench PolynesiaGabonGambia, TheGeorgiaGermanyGhanaGibraltarGreeceGreenlandGrenadaGuamGuatemalaGuineaGuinea-BissauGuyanaHaitiHeavily indebted poor countries (HIPC)High incomeHondurasHong Kong SAR, ChinaHungaryIBRD onlyIcelandIDA & IBRD totalIDA blendIDA onlyIDA totalIndiaIndonesiaIran, Islamic Rep.IraqIrelandIsraelItalyJamaicaJapanJordanKazakhstanKenyaKiribatiKorea, Dem. People’s Rep.Korea, Rep.KosovoKuwaitKyrgyz RepublicLao PDRLate-demographic dividendLatin America & Caribbean Latin America & Caribbean (excluding high income)Latin America & the Caribbean (IDA & IBRD countries)LatviaLeast developed countries: UN classificationLebanonLiberiaLibyaLithuaniaLow & middle incomeLow incomeLower middle incomeLuxembourgMacao SAR, ChinaMacedonia, FYRMadagascarMalawiMalaysiaMaldivesMaliMaltaMauritaniaMauritiusMexicoMiddle East & North AfricaMiddle East & North Africa (excluding high income)Middle East & North Africa (IDA & IBRD countries)Middle incomeMoldovaMongoliaMontenegroMoroccoMozambiqueMyanmarNauruNepalNetherlandsNew CaledoniaNew ZealandNicaraguaNigerNigeriaNorth AmericaNorwayOECD membersOmanOther small statesPacific island small statesPakistanPanamaPapua New GuineaParaguayPeruPhilippinesPolandPortugalPost-demographic dividendPre-demographic dividendQatarRomaniaRussian FederationRwandaSamoaSao Tome and PrincipeSaudi ArabiaSenegalSerbiaSeychellesSierra LeoneSingaporeSlovak RepublicSloveniaSmall statesSolomon IslandsSomaliaSouth AfricaSouth AsiaSouth Asia (IDA & IBRD)SpainSri LankaSt. Kitts and NevisSt. LuciaSt. Vincent and the GrenadinesSub-Saharan Africa Sub-Saharan Africa (excluding high income)Sub-Saharan Africa (IDA & IBRD countries)SudanSurinameSwedenSwitzerlandSyrian Arab RepublicTajikistanTanzaniaThailandTogoTongaTrinidad and TobagoTunisiaTurkeyTurkmenistanTuvaluUgandaUkraineUnited Arab EmiratesUnited KingdomUnited StatesUpper middle incomeUruguayUzbekistanVanuatuVenezuela, RBVietnamWorldYemen, Rep.ZambiaZimbabwe Timeline:
This timeline shows a graph from 1961 to 2015 of Denmark. No data until 1960. Number of actual observations by date: 55.
Source name:
World Development Indicators
Source organization:
World Bank staff estimates based data from International Monetary Fund's Direction of Trade database.
Categories, topics:
Private Sector, Trade
Last updated:
apr 23, 2017
Indicators value changes by year
At the date of observation
Value
Absolute change
Change from previous value
jan 1, 1961
4.365
+4.365
0.0%
jan 1, 1962
4.118
-0.247
-5.65%
jan 1, 1963
5.105
+0.986
23.95%
jan 1, 1964
5.127
+0.022
0.43%
jan 1, 1965
5.093
-0.034
-0.65%
jan 1, 1966
5.287
+0.194
3.81%
jan 1, 1967
4.347
-0.941
-17.79%
jan 1, 1968
4.945
+0.598
13.76%
jan 1, 1969
4.906
-0.039
-0.78%
jan 1, 1970
4.259
-0.647
-13.18%
jan 1, 1971
4.152
-0.107
-2.52%
jan 1, 1972
4.328
+0.175
4.22%
jan 1, 1973
4.025
-0.303
-6.99%
jan 1, 1974
3.864
-0.161
-3.99%
jan 1, 1975
3.929
+0.065
1.68%
jan 1, 1976
3.925
-0.005
-0.12%
jan 1, 1977
4.144
+0.219
5.58%
jan 1, 1978
4.137
-0.007
-0.16%
jan 1, 1979
4.542
+0.406
9.8%
jan 1, 1980
4.129
-0.413
-9.09%
jan 1, 1981
4.243
+0.114
2.77%
jan 1, 1982
3.642
-0.601
-14.17%
jan 1, 1983
3.475
-0.167
-4.6%
jan 1, 1984
3.456
-0.019
-0.54%
jan 1, 1985
3.554
+0.098
2.84%
jan 1, 1986
3.676
+0.122
3.44%
jan 1, 1987
4.078
+0.401
10.91%
jan 1, 1988
4.035
-0.043
-1.05%
jan 1, 1989
4.074
+0.039
0.97%
jan 1, 1990
4.266
+0.192
4.72%
jan 1, 1991
4.188
-0.078
-1.82%
jan 1, 1992
3.667
-0.522
-12.46%
jan 1, 1993
3.194
-0.473
-12.89%
jan 1, 1994
2.206
-0.988
-30.92%
jan 1, 1995
2.232
+0.026
1.18%
jan 1, 1996
2.108
-0.125
-5.59%
jan 1, 1997
2.296
+0.188
8.92%
jan 1, 1998
2.258
-0.037
-1.63%
jan 1, 1999
2.269
+0.011
0.48%
jan 1, 2000
0.178
-2.091
-92.16%
jan 1, 2001
0.147
-0.031
-17.39%
jan 1, 2002
0.53
+0.383
260.54%
jan 1, 2003
0.578
+0.048
9.05%
jan 1, 2004
0.635
+0.057
9.78%
jan 1, 2005
0.712
+0.077
12.16%
jan 1, 2006
0.83
+0.118
16.62%
jan 1, 2007
0.142
-0.688
-82.92%
jan 1, 2008
0.404
+0.262
184.76%
jan 1, 2009
0.863
+0.459
113.81%
jan 1, 2010
0.532
-0.331
-38.33%
jan 1, 2011
0.289
-0.243
-45.74%
jan 1, 2012
0.494
+0.205
70.95%
jan 1, 2013
0.642
+0.149
30.13%
jan 1, 2014
0.459
-0.184
-28.58%
jan 1, 2015
0.46
+0.001
0.22%
Ranking of countries by current statistics by years


Comments: