29
/
en
AIzaSyAYiBZKx7MnpbEhh9jyipgxe19OcubqV5w
April 1, 2024
261177
Tanzania
TZA
true
2
1
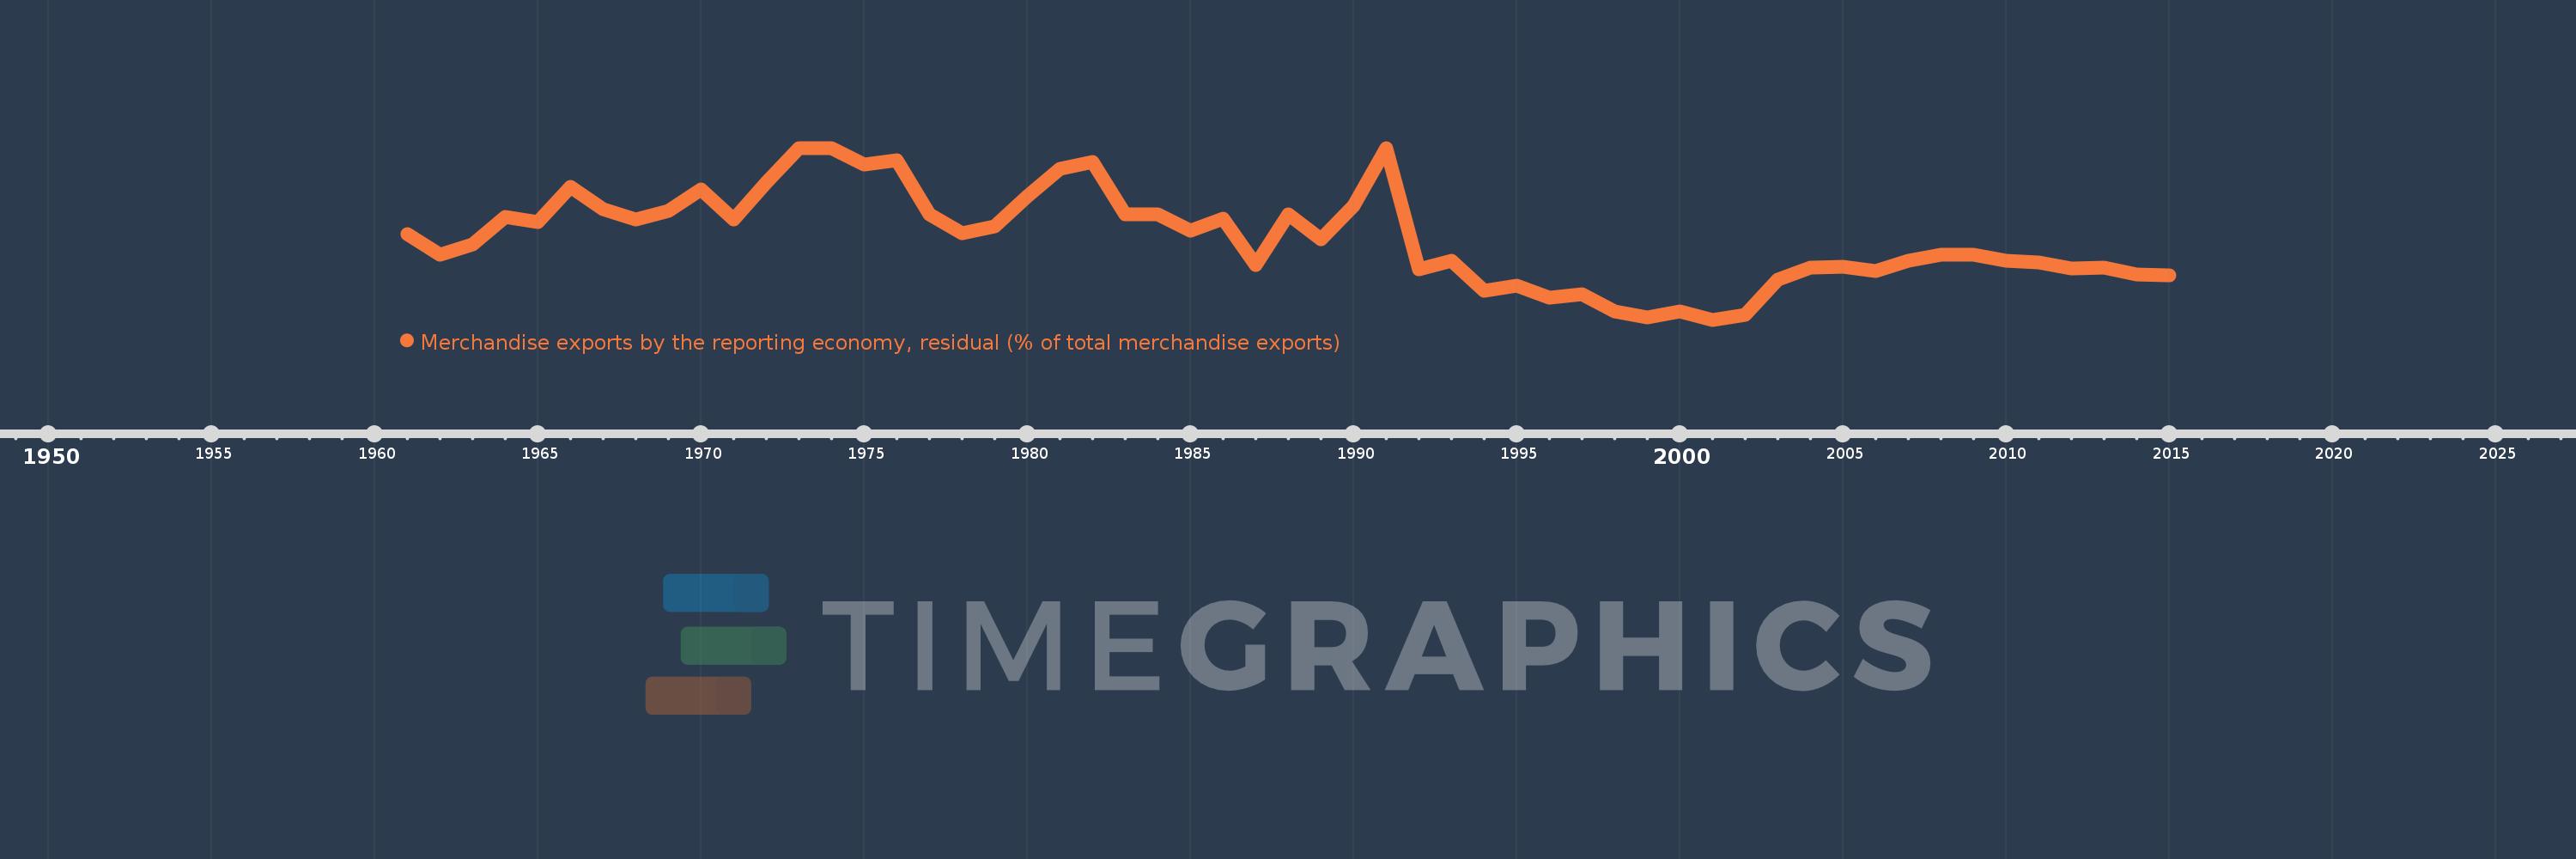
Merchandise exports by the reporting economy, residual (% of total merchandise exports)
2015,2014,2013,2012,2011,2010,2009,2008,2007,2006,2005,2004,2003,2002,2001,2000,1999,1998,1997,1996,1995,1994,1993,1992,1991,1990,1989,1988,1987,1986,1985,1984,1983,1982,1981,1980,1979,1978,1977,1976,1975,1974,1973,1972,1971,1970,1969,1968,1967,1966,1965,1964,1963,1962,1961
This statistics in other country:
AfghanistanAlbaniaAlgeriaAmerican SamoaAngolaAntigua and BarbudaArab WorldArgentinaArmeniaArubaAustraliaAustriaAzerbaijanBahamas, TheBahrainBangladeshBarbadosBelarusBelgiumBelizeBeninBermudaBoliviaBosnia and HerzegovinaBrazilBrunei DarussalamBulgariaBurkina FasoBurundiCabo VerdeCambodiaCameroonCanadaCaribbean small statesCentral African RepublicCentral Europe and the BalticsChadChileChinaColombiaComorosCongo, Dem. Rep.Congo, Rep.Costa RicaCote d'IvoireCroatiaCubaCyprusCzech RepublicDenmarkDjiboutiDominicaDominican RepublicEarly-demographic dividendEast Asia & PacificEast Asia & Pacific (excluding high income)East Asia & Pacific (IDA & IBRD countries)EcuadorEgypt, Arab Rep.El SalvadorEquatorial GuineaEstoniaEthiopiaEuro areaEurope & Central AsiaEurope & Central Asia (excluding high income)Europe & Central Asia (IDA & IBRD countries)European UnionFaroe IslandsFijiFinlandFragile and conflict affected situationsFranceFrench PolynesiaGabonGambia, TheGeorgiaGermanyGhanaGibraltarGreeceGreenlandGrenadaGuamGuatemalaGuineaGuinea-BissauGuyanaHaitiHeavily indebted poor countries (HIPC)High incomeHondurasHong Kong SAR, ChinaHungaryIBRD onlyIcelandIDA & IBRD totalIDA blendIDA onlyIDA totalIndiaIndonesiaIran, Islamic Rep.IraqIrelandIsraelItalyJamaicaJapanJordanKazakhstanKenyaKiribatiKorea, Dem. People’s Rep.Korea, Rep.KosovoKuwaitKyrgyz RepublicLao PDRLate-demographic dividendLatin America & Caribbean Latin America & Caribbean (excluding high income)Latin America & the Caribbean (IDA & IBRD countries)LatviaLeast developed countries: UN classificationLebanonLiberiaLibyaLithuaniaLow & middle incomeLow incomeLower middle incomeLuxembourgMacao SAR, ChinaMacedonia, FYRMadagascarMalawiMalaysiaMaldivesMaliMaltaMauritaniaMauritiusMexicoMiddle East & North AfricaMiddle East & North Africa (excluding high income)Middle East & North Africa (IDA & IBRD countries)Middle incomeMoldovaMongoliaMontenegroMoroccoMozambiqueMyanmarNauruNepalNetherlandsNew CaledoniaNew ZealandNicaraguaNigerNigeriaNorth AmericaNorwayOECD membersOmanOther small statesPacific island small statesPakistanPanamaPapua New GuineaParaguayPeruPhilippinesPolandPortugalPost-demographic dividendPre-demographic dividendQatarRomaniaRussian FederationRwandaSamoaSao Tome and PrincipeSaudi ArabiaSenegalSerbiaSeychellesSierra LeoneSingaporeSlovak RepublicSloveniaSmall statesSolomon IslandsSomaliaSouth AfricaSouth AsiaSouth Asia (IDA & IBRD)SpainSri LankaSt. Kitts and NevisSt. LuciaSt. Vincent and the GrenadinesSub-Saharan Africa Sub-Saharan Africa (excluding high income)Sub-Saharan Africa (IDA & IBRD countries)SudanSurinameSwedenSwitzerlandSyrian Arab RepublicTajikistanTanzaniaThailandTogoTongaTrinidad and TobagoTunisiaTurkeyTurkmenistanTuvaluUgandaUkraineUnited Arab EmiratesUnited KingdomUnited StatesUpper middle incomeUruguayUzbekistanVanuatuVenezuela, RBVietnamWorldYemen, Rep.ZambiaZimbabwe Timeline:
This timeline shows a graph from 1961 to 2015 of Tanzania. No data until 1960. Number of actual observations by date: 55.
Source name:
World Development Indicators
Source organization:
World Bank staff estimates based data from International Monetary Fund's Direction of Trade database.
Categories, topics:
Private Sector, Trade
Last updated:
apr 23, 2017
Indicators value changes by year
Maximum:
29.461
jan 1, 1973
At the date of observation
Value
Absolute change
Change from previous value
jan 1, 1961
15.175
+15.175
0.0%
jan 1, 1962
11.722
-3.453
-22.75%
jan 1, 1963
13.433
+1.711
14.59%
jan 1, 1964
17.939
+4.506
33.54%
jan 1, 1965
17.206
-0.732
-4.08%
jan 1, 1966
22.938
+5.731
33.31%
jan 1, 1967
19.329
-3.609
-15.73%
jan 1, 1968
17.524
-1.805
-9.34%
jan 1, 1969
18.977
+1.453
8.29%
jan 1, 1970
22.634
+3.657
19.27%
jan 1, 1971
17.632
-5.002
-22.1%
jan 1, 1972
23.745
+6.113
34.67%
jan 1, 1973
29.461
+5.715
24.07%
jan 1, 1974
29.435
-0.026
-0.09%
jan 1, 1975
26.722
-2.713
-9.22%
jan 1, 1976
27.405
+0.684
2.56%
jan 1, 1977
18.4
-9.006
-32.86%
jan 1, 1978
15.252
-3.147
-17.11%
jan 1, 1979
16.499
+1.246
8.17%
jan 1, 1980
21.384
+4.885
29.61%
jan 1, 1981
25.965
+4.581
21.43%
jan 1, 1982
27.143
+1.178
4.54%
jan 1, 1983
18.442
-8.701
-32.05%
jan 1, 1984
18.425
-0.017
-0.09%
jan 1, 1985
15.664
-2.761
-14.98%
jan 1, 1986
17.77
+2.106
13.44%
jan 1, 1987
9.947
-7.823
-44.02%
jan 1, 1988
18.369
+8.422
84.68%
jan 1, 1989
14.301
-4.068
-22.15%
jan 1, 1990
19.907
+5.606
39.2%
jan 1, 1991
29.393
+9.486
47.65%
jan 1, 1992
9.302
-20.09
-68.35%
jan 1, 1993
10.666
+1.363
14.65%
jan 1, 1994
5.689
-4.976
-46.66%
jan 1, 1995
6.649
+0.96
16.87%
jan 1, 1996
4.624
-2.025
-30.46%
jan 1, 1997
5.147
+0.523
11.32%
jan 1, 1998
2.327
-2.82
-54.79%
jan 1, 1999
1.364
-0.963
-41.4%
jan 1, 2000
2.324
+0.961
70.44%
jan 1, 2001
0.924
-1.4
-60.23%
jan 1, 2002
1.679
+0.754
81.62%
jan 1, 2003
7.523
+5.844
348.11%
jan 1, 2004
9.651
+2.128
28.29%
jan 1, 2005
9.673
+0.022
0.23%
jan 1, 2006
9.077
-0.597
-6.17%
jan 1, 2007
10.673
+1.597
17.59%
jan 1, 2008
11.704
+1.031
9.66%
jan 1, 2009
11.709
+0.005
0.05%
jan 1, 2010
10.693
-1.016
-8.68%
jan 1, 2011
10.464
-0.23
-2.15%
jan 1, 2012
9.481
-0.983
-9.39%
jan 1, 2013
9.55
+0.069
0.73%
jan 1, 2014
8.442
-1.108
-11.6%
jan 1, 2015
8.344
-0.098
-1.16%
Ranking of countries by current statistics by years


Comments: