29
/
en
AIzaSyAYiBZKx7MnpbEhh9jyipgxe19OcubqV5w
April 1, 2024
26714
Early-demographic dividend
EAR
false
2
1
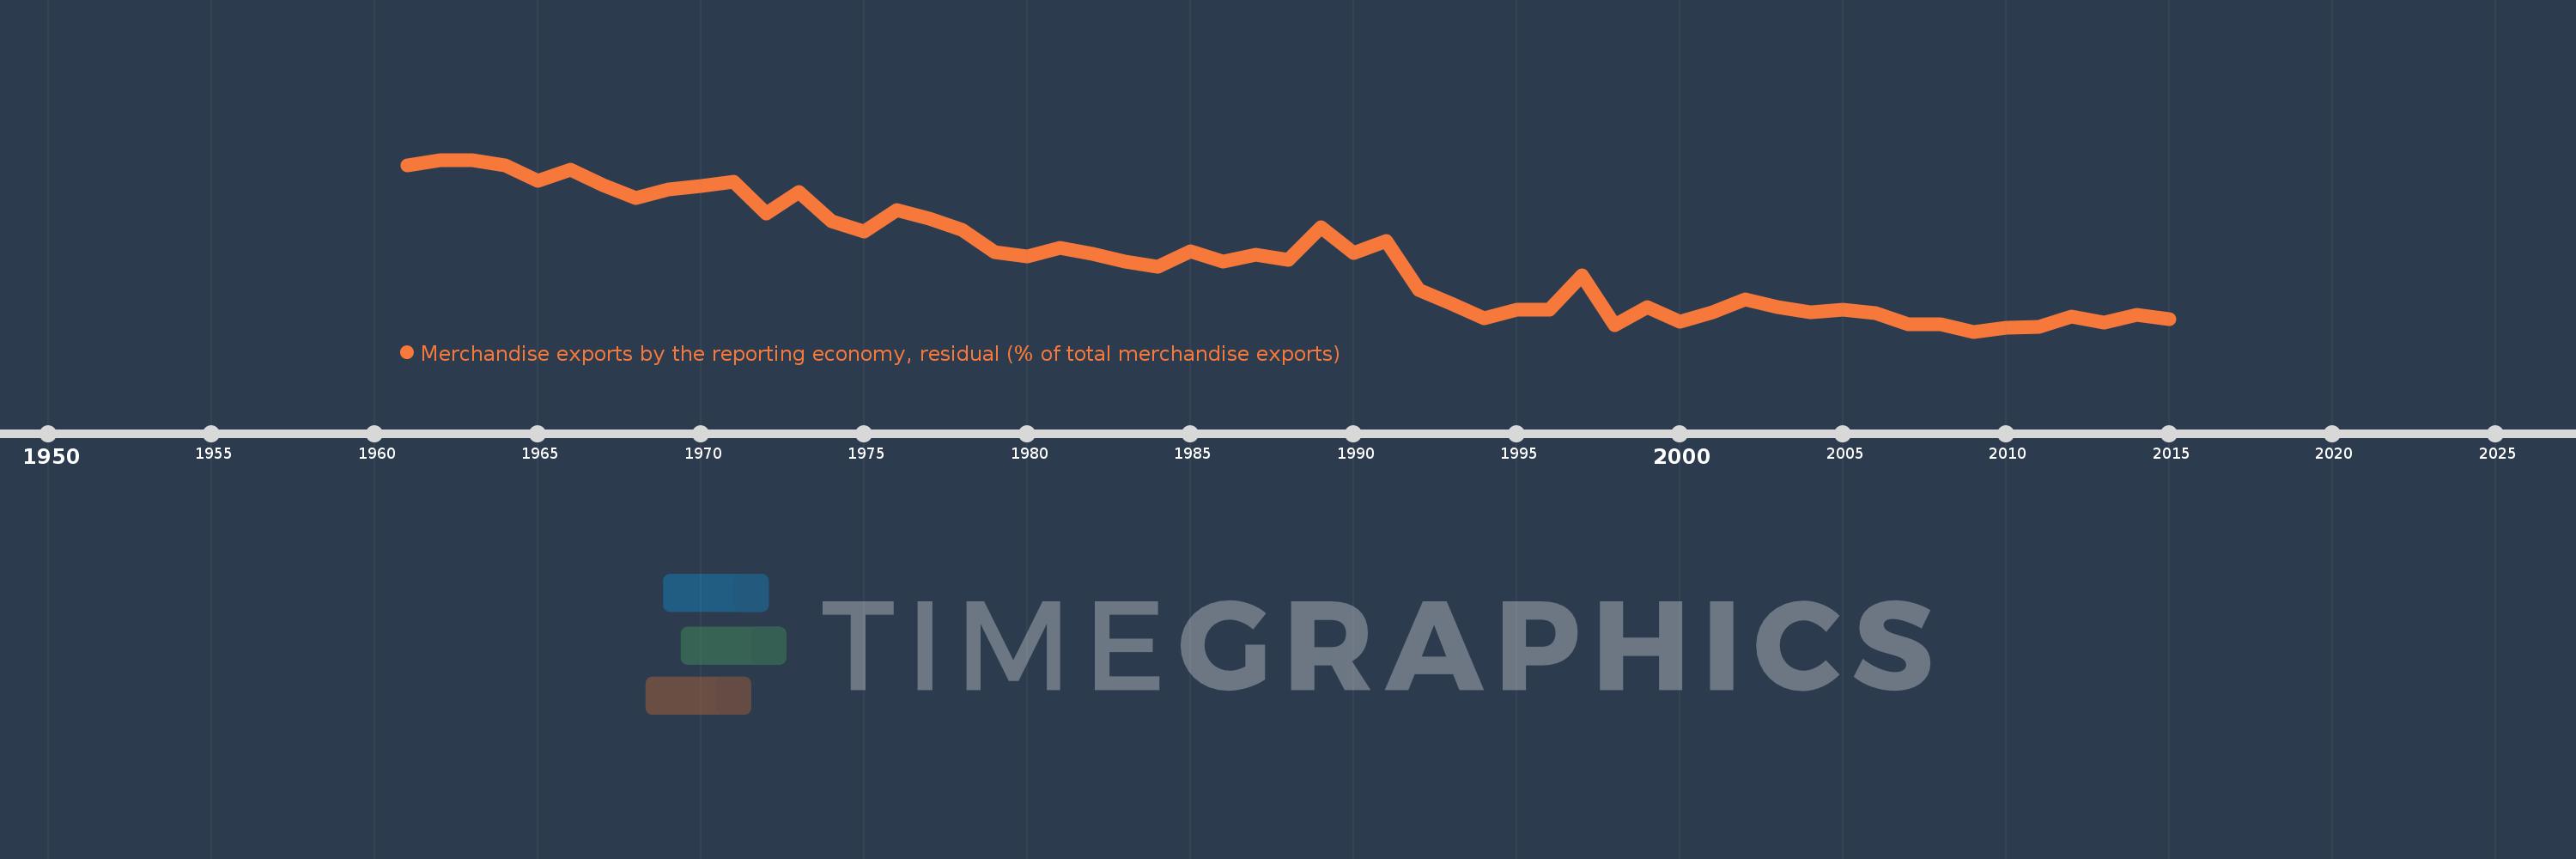
Merchandise exports by the reporting economy, residual (% of total merchandise exports)
2015,2014,2013,2012,2011,2010,2009,2008,2007,2006,2005,2004,2003,2002,2001,2000,1999,1998,1997,1996,1995,1994,1993,1992,1991,1990,1989,1988,1987,1986,1985,1984,1983,1982,1981,1980,1979,1978,1977,1976,1975,1974,1973,1972,1971,1970,1969,1968,1967,1966,1965,1964,1963,1962,1961
This statistics in other country:
AfghanistanAlbaniaAlgeriaAmerican SamoaAngolaAntigua and BarbudaArab WorldArgentinaArmeniaArubaAustraliaAustriaAzerbaijanBahamas, TheBahrainBangladeshBarbadosBelarusBelgiumBelizeBeninBermudaBoliviaBosnia and HerzegovinaBrazilBrunei DarussalamBulgariaBurkina FasoBurundiCabo VerdeCambodiaCameroonCanadaCaribbean small statesCentral African RepublicCentral Europe and the BalticsChadChileChinaColombiaComorosCongo, Dem. Rep.Congo, Rep.Costa RicaCote d'IvoireCroatiaCubaCyprusCzech RepublicDenmarkDjiboutiDominicaDominican RepublicEarly-demographic dividendEast Asia & PacificEast Asia & Pacific (excluding high income)East Asia & Pacific (IDA & IBRD countries)EcuadorEgypt, Arab Rep.El SalvadorEquatorial GuineaEstoniaEthiopiaEuro areaEurope & Central AsiaEurope & Central Asia (excluding high income)Europe & Central Asia (IDA & IBRD countries)European UnionFaroe IslandsFijiFinlandFragile and conflict affected situationsFranceFrench PolynesiaGabonGambia, TheGeorgiaGermanyGhanaGibraltarGreeceGreenlandGrenadaGuamGuatemalaGuineaGuinea-BissauGuyanaHaitiHeavily indebted poor countries (HIPC)High incomeHondurasHong Kong SAR, ChinaHungaryIBRD onlyIcelandIDA & IBRD totalIDA blendIDA onlyIDA totalIndiaIndonesiaIran, Islamic Rep.IraqIrelandIsraelItalyJamaicaJapanJordanKazakhstanKenyaKiribatiKorea, Dem. People’s Rep.Korea, Rep.KosovoKuwaitKyrgyz RepublicLao PDRLate-demographic dividendLatin America & Caribbean Latin America & Caribbean (excluding high income)Latin America & the Caribbean (IDA & IBRD countries)LatviaLeast developed countries: UN classificationLebanonLiberiaLibyaLithuaniaLow & middle incomeLow incomeLower middle incomeLuxembourgMacao SAR, ChinaMacedonia, FYRMadagascarMalawiMalaysiaMaldivesMaliMaltaMauritaniaMauritiusMexicoMiddle East & North AfricaMiddle East & North Africa (excluding high income)Middle East & North Africa (IDA & IBRD countries)Middle incomeMoldovaMongoliaMontenegroMoroccoMozambiqueMyanmarNauruNepalNetherlandsNew CaledoniaNew ZealandNicaraguaNigerNigeriaNorth AmericaNorwayOECD membersOmanOther small statesPacific island small statesPakistanPanamaPapua New GuineaParaguayPeruPhilippinesPolandPortugalPost-demographic dividendPre-demographic dividendQatarRomaniaRussian FederationRwandaSamoaSao Tome and PrincipeSaudi ArabiaSenegalSerbiaSeychellesSierra LeoneSingaporeSlovak RepublicSloveniaSmall statesSolomon IslandsSomaliaSouth AfricaSouth AsiaSouth Asia (IDA & IBRD)SpainSri LankaSt. Kitts and NevisSt. LuciaSt. Vincent and the GrenadinesSub-Saharan Africa Sub-Saharan Africa (excluding high income)Sub-Saharan Africa (IDA & IBRD countries)SudanSurinameSwedenSwitzerlandSyrian Arab RepublicTajikistanTanzaniaThailandTogoTongaTrinidad and TobagoTunisiaTurkeyTurkmenistanTuvaluUgandaUkraineUnited Arab EmiratesUnited KingdomUnited StatesUpper middle incomeUruguayUzbekistanVanuatuVenezuela, RBVietnamWorldYemen, Rep.ZambiaZimbabwe Timeline:
This timeline shows a graph from 1961 to 2015 of Early-demographic dividend. No data until 1960. Number of actual observations by date: 55.
Source name:
World Development Indicators
Source organization:
World Bank staff estimates based data from International Monetary Fund's Direction of Trade database.
Categories, topics:
Private Sector, Trade
Last updated:
apr 23, 2017
Indicators value changes by year
Maximum:
13.808
jan 1, 1962
At the date of observation
Value
Absolute change
Change from previous value
jan 1, 1961
13.517
+13.517
0.0%
jan 1, 1962
13.808
+0.291
2.15%
jan 1, 1963
13.785
-0.023
-0.16%
jan 1, 1964
13.487
-0.298
-2.16%
jan 1, 1965
12.618
-0.869
-6.44%
jan 1, 1966
13.245
+0.626
4.96%
jan 1, 1967
12.407
-0.837
-6.32%
jan 1, 1968
11.7
-0.707
-5.7%
jan 1, 1969
12.156
+0.456
3.9%
jan 1, 1970
12.334
+0.178
1.46%
jan 1, 1971
12.574
+0.239
1.94%
jan 1, 1972
10.814
-1.759
-13.99%
jan 1, 1973
12.0
+1.186
10.97%
jan 1, 1974
10.397
-1.603
-13.36%
jan 1, 1975
9.816
-0.581
-5.59%
jan 1, 1976
11.001
+1.185
12.07%
jan 1, 1977
10.525
-0.476
-4.33%
jan 1, 1978
9.92
-0.605
-5.75%
jan 1, 1979
8.666
-1.253
-12.63%
jan 1, 1980
8.408
-0.258
-2.98%
jan 1, 1981
8.894
+0.486
5.79%
jan 1, 1982
8.566
-0.328
-3.69%
jan 1, 1983
8.142
-0.424
-4.95%
jan 1, 1984
7.866
-0.276
-3.39%
jan 1, 1985
8.686
+0.82
10.42%
jan 1, 1986
8.149
-0.537
-6.19%
jan 1, 1987
8.52
+0.371
4.56%
jan 1, 1988
8.246
-0.274
-3.22%
jan 1, 1989
10.047
+1.802
21.85%
jan 1, 1990
8.617
-1.43
-14.23%
jan 1, 1991
9.261
+0.644
7.47%
jan 1, 1992
6.533
-2.728
-29.46%
jan 1, 1993
5.79
-0.743
-11.37%
jan 1, 1994
4.987
-0.803
-13.86%
jan 1, 1995
5.471
+0.484
9.7%
jan 1, 1996
5.459
-0.013
-0.23%
jan 1, 1997
7.344
+1.886
34.54%
jan 1, 1998
4.588
-2.756
-37.53%
jan 1, 1999
5.615
+1.026
22.37%
jan 1, 2000
4.796
-0.819
-14.58%
jan 1, 2001
5.328
+0.532
11.09%
jan 1, 2002
6.006
+0.678
12.72%
jan 1, 2003
5.602
-0.404
-6.72%
jan 1, 2004
5.303
-0.299
-5.34%
jan 1, 2005
5.464
+0.161
3.03%
jan 1, 2006
5.246
-0.218
-3.99%
jan 1, 2007
4.625
-0.622
-11.85%
jan 1, 2008
4.66
+0.036
0.77%
jan 1, 2009
4.229
-0.431
-9.25%
jan 1, 2010
4.459
+0.23
5.44%
jan 1, 2011
4.475
+0.015
0.34%
jan 1, 2012
5.071
+0.597
13.34%
jan 1, 2013
4.726
-0.346
-6.82%
jan 1, 2014
5.178
+0.453
9.58%
jan 1, 2015
4.944
-0.234
-4.52%
Ranking of countries by current statistics by years


Comments: