29
/
en
AIzaSyAYiBZKx7MnpbEhh9jyipgxe19OcubqV5w
April 1, 2024
152781
Hungary
HUN
true
2
1
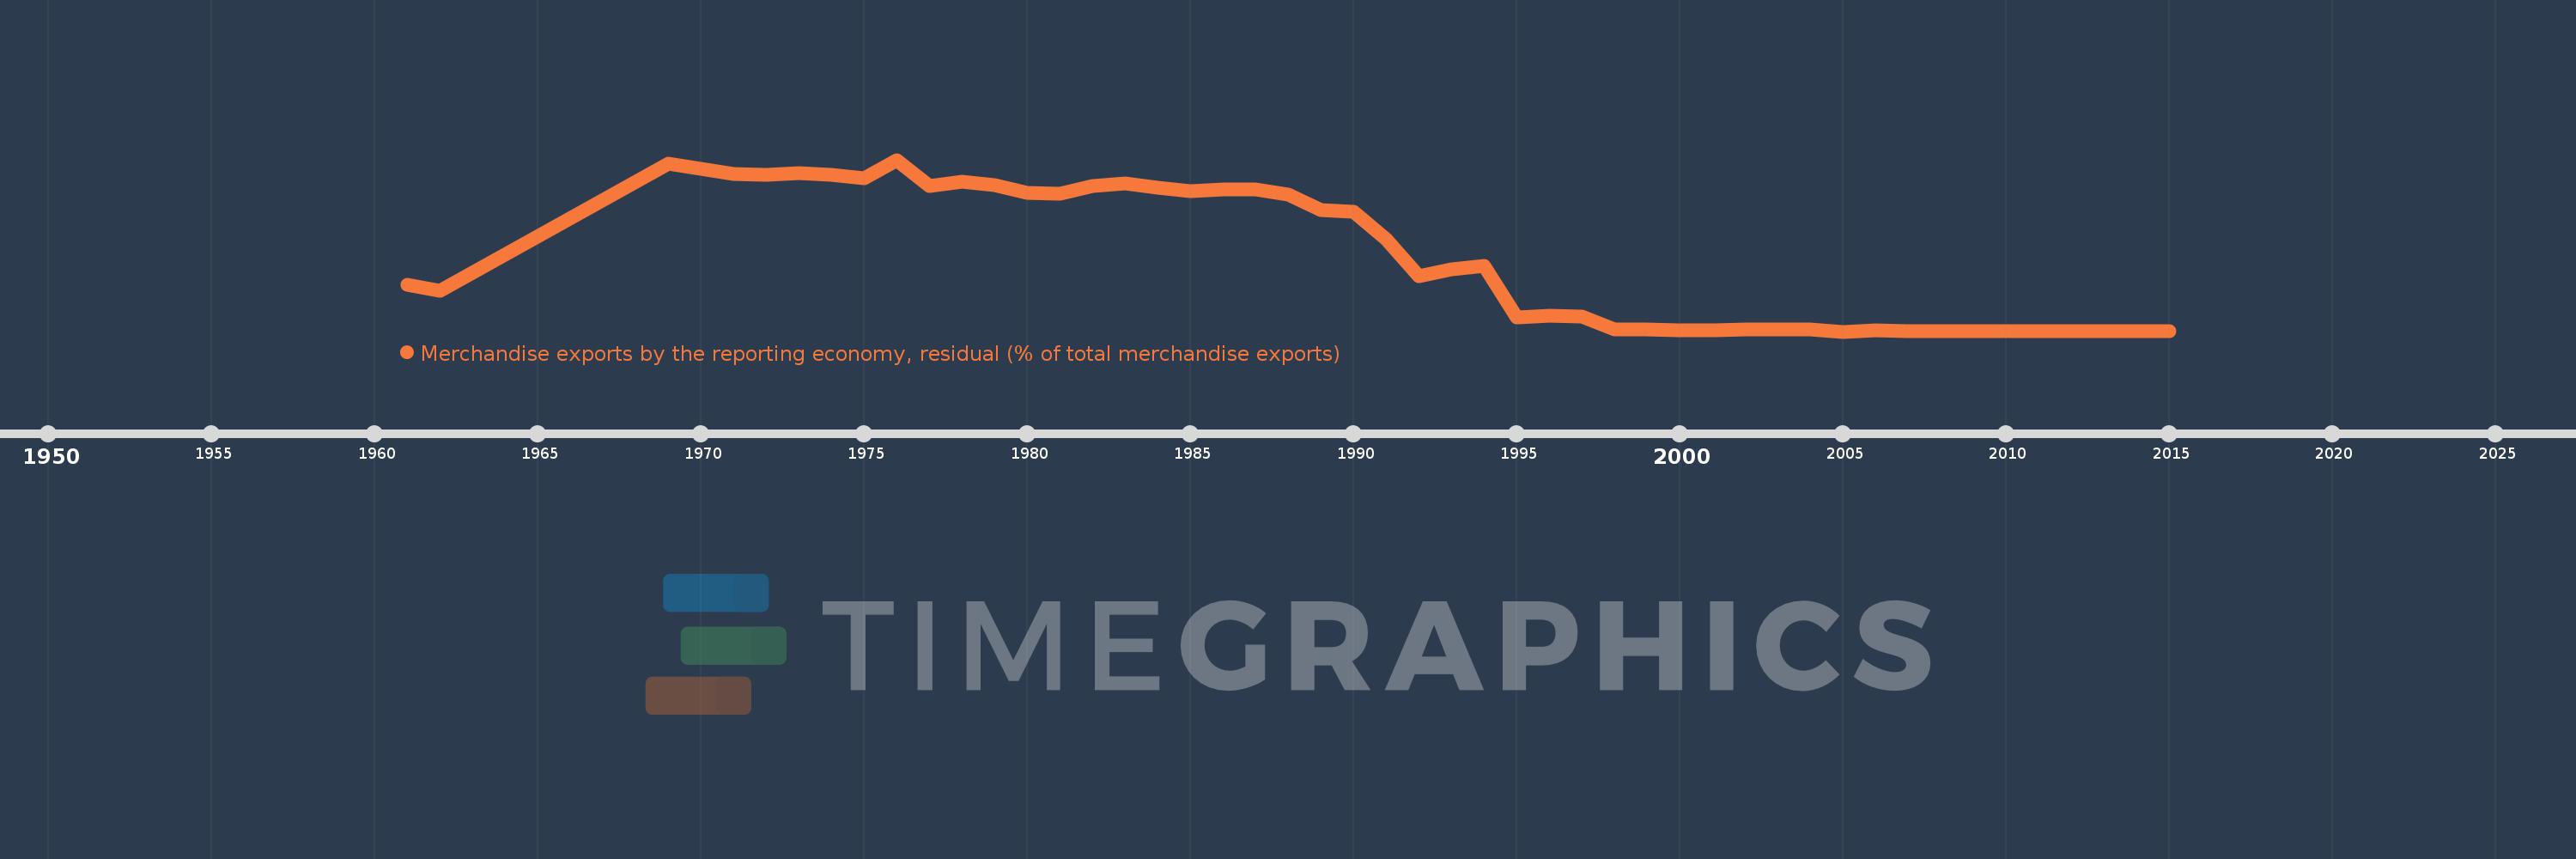
Merchandise exports by the reporting economy, residual (% of total merchandise exports)
2015,2014,2013,2012,2011,2010,2009,2008,2007,2006,2005,2004,2003,2002,2001,2000,1999,1998,1997,1996,1995,1994,1993,1992,1991,1990,1989,1988,1987,1986,1985,1984,1983,1982,1981,1980,1979,1978,1977,1976,1975,1974,1973,1972,1971,1970,1969,1962,1961
This statistics in other country:
AfghanistanAlbaniaAlgeriaAmerican SamoaAngolaAntigua and BarbudaArab WorldArgentinaArmeniaArubaAustraliaAustriaAzerbaijanBahamas, TheBahrainBangladeshBarbadosBelarusBelgiumBelizeBeninBermudaBoliviaBosnia and HerzegovinaBrazilBrunei DarussalamBulgariaBurkina FasoBurundiCabo VerdeCambodiaCameroonCanadaCaribbean small statesCentral African RepublicCentral Europe and the BalticsChadChileChinaColombiaComorosCongo, Dem. Rep.Congo, Rep.Costa RicaCote d'IvoireCroatiaCubaCyprusCzech RepublicDenmarkDjiboutiDominicaDominican RepublicEarly-demographic dividendEast Asia & PacificEast Asia & Pacific (excluding high income)East Asia & Pacific (IDA & IBRD countries)EcuadorEgypt, Arab Rep.El SalvadorEquatorial GuineaEstoniaEthiopiaEuro areaEurope & Central AsiaEurope & Central Asia (excluding high income)Europe & Central Asia (IDA & IBRD countries)European UnionFaroe IslandsFijiFinlandFragile and conflict affected situationsFranceFrench PolynesiaGabonGambia, TheGeorgiaGermanyGhanaGibraltarGreeceGreenlandGrenadaGuamGuatemalaGuineaGuinea-BissauGuyanaHaitiHeavily indebted poor countries (HIPC)High incomeHondurasHong Kong SAR, ChinaHungaryIBRD onlyIcelandIDA & IBRD totalIDA blendIDA onlyIDA totalIndiaIndonesiaIran, Islamic Rep.IraqIrelandIsraelItalyJamaicaJapanJordanKazakhstanKenyaKiribatiKorea, Dem. People’s Rep.Korea, Rep.KosovoKuwaitKyrgyz RepublicLao PDRLate-demographic dividendLatin America & Caribbean Latin America & Caribbean (excluding high income)Latin America & the Caribbean (IDA & IBRD countries)LatviaLeast developed countries: UN classificationLebanonLiberiaLibyaLithuaniaLow & middle incomeLow incomeLower middle incomeLuxembourgMacao SAR, ChinaMacedonia, FYRMadagascarMalawiMalaysiaMaldivesMaliMaltaMauritaniaMauritiusMexicoMiddle East & North AfricaMiddle East & North Africa (excluding high income)Middle East & North Africa (IDA & IBRD countries)Middle incomeMoldovaMongoliaMontenegroMoroccoMozambiqueMyanmarNauruNepalNetherlandsNew CaledoniaNew ZealandNicaraguaNigerNigeriaNorth AmericaNorwayOECD membersOmanOther small statesPacific island small statesPakistanPanamaPapua New GuineaParaguayPeruPhilippinesPolandPortugalPost-demographic dividendPre-demographic dividendQatarRomaniaRussian FederationRwandaSamoaSao Tome and PrincipeSaudi ArabiaSenegalSerbiaSeychellesSierra LeoneSingaporeSlovak RepublicSloveniaSmall statesSolomon IslandsSomaliaSouth AfricaSouth AsiaSouth Asia (IDA & IBRD)SpainSri LankaSt. Kitts and NevisSt. LuciaSt. Vincent and the GrenadinesSub-Saharan Africa Sub-Saharan Africa (excluding high income)Sub-Saharan Africa (IDA & IBRD countries)SudanSurinameSwedenSwitzerlandSyrian Arab RepublicTajikistanTanzaniaThailandTogoTongaTrinidad and TobagoTunisiaTurkeyTurkmenistanTuvaluUgandaUkraineUnited Arab EmiratesUnited KingdomUnited StatesUpper middle incomeUruguayUzbekistanVanuatuVenezuela, RBVietnamWorldYemen, Rep.ZambiaZimbabwe Timeline:
This timeline shows a graph from 1961 to 2015 of Hungary. No data until 1960. Number of actual observations by date: 49.
Source name:
World Development Indicators
Source organization:
World Bank staff estimates based data from International Monetary Fund's Direction of Trade database.
Categories, topics:
Private Sector, Trade
Last updated:
apr 23, 2017
Indicators value changes by year
Maximum:
64.112
jan 1, 1976
At the date of observation
Value
Absolute change
Change from previous value
jan 1, 1961
17.574
+17.574
0.0%
jan 1, 1962
15.183
-2.391
-13.6%
jan 1, 1969
62.587
+47.404
312.22%
jan 1, 1970
60.606
-1.982
-3.17%
jan 1, 1971
58.849
-1.757
-2.9%
jan 1, 1972
58.422
-0.427
-0.73%
jan 1, 1973
59.217
+0.795
1.36%
jan 1, 1974
58.518
-0.699
-1.18%
jan 1, 1975
57.166
-1.352
-2.31%
jan 1, 1976
64.112
+6.946
12.15%
jan 1, 1977
54.278
-9.834
-15.34%
jan 1, 1978
55.825
+1.546
2.85%
jan 1, 1979
54.568
-1.257
-2.25%
jan 1, 1980
51.71
-2.858
-5.24%
jan 1, 1981
51.495
-0.214
-0.41%
jan 1, 1982
54.492
+2.997
5.82%
jan 1, 1983
55.16
+0.668
1.23%
jan 1, 1984
53.717
-1.443
-2.62%
jan 1, 1985
52.332
-1.386
-2.58%
jan 1, 1986
53.04
+0.708
1.35%
jan 1, 1987
53.157
+0.118
0.22%
jan 1, 1988
51.098
-2.06
-3.87%
jan 1, 1989
45.24
-5.858
-11.46%
jan 1, 1990
44.577
-0.662
-1.46%
jan 1, 1991
34.503
-10.074
-22.6%
jan 1, 1992
20.746
-13.758
-39.87%
jan 1, 1993
23.163
+2.417
11.65%
jan 1, 1994
24.472
+1.309
5.65%
jan 1, 1995
5.244
-19.228
-78.57%
jan 1, 1996
5.942
+0.698
13.31%
jan 1, 1997
5.489
-0.453
-7.62%
jan 1, 1998
0.852
-4.638
-84.49%
jan 1, 1999
0.65
-0.201
-23.62%
jan 1, 2000
0.46
-0.191
-29.31%
jan 1, 2001
0.638
+0.179
38.83%
jan 1, 2002
0.647
+0.008
1.3%
jan 1, 2003
0.66
+0.014
2.14%
jan 1, 2004
0.742
+0.081
12.32%
jan 1, 2005
0.002
-0.739
-99.67%
jan 1, 2006
0.386
+0.384
15.89K%
jan 1, 2007
0.052
-0.334
-86.45%
jan 1, 2008
0.027
-0.025
-48.36%
jan 1, 2009
0.032
+0.005
19.62%
jan 1, 2010
0.043
+0.011
33.94%
jan 1, 2011
0.043
+0.0
0.29%
jan 1, 2012
0.046
+0.003
6.51%
jan 1, 2013
0.046
+0.0
0.52%
jan 1, 2014
0.047
+0.0
0.97%
jan 1, 2015
0.043
-0.004
-9.0%
Ranking of countries by current statistics by years


Comments: