29
/
en
AIzaSyAYiBZKx7MnpbEhh9jyipgxe19OcubqV5w
April 1, 2024
162828
Jamaica
JAM
true
2
1
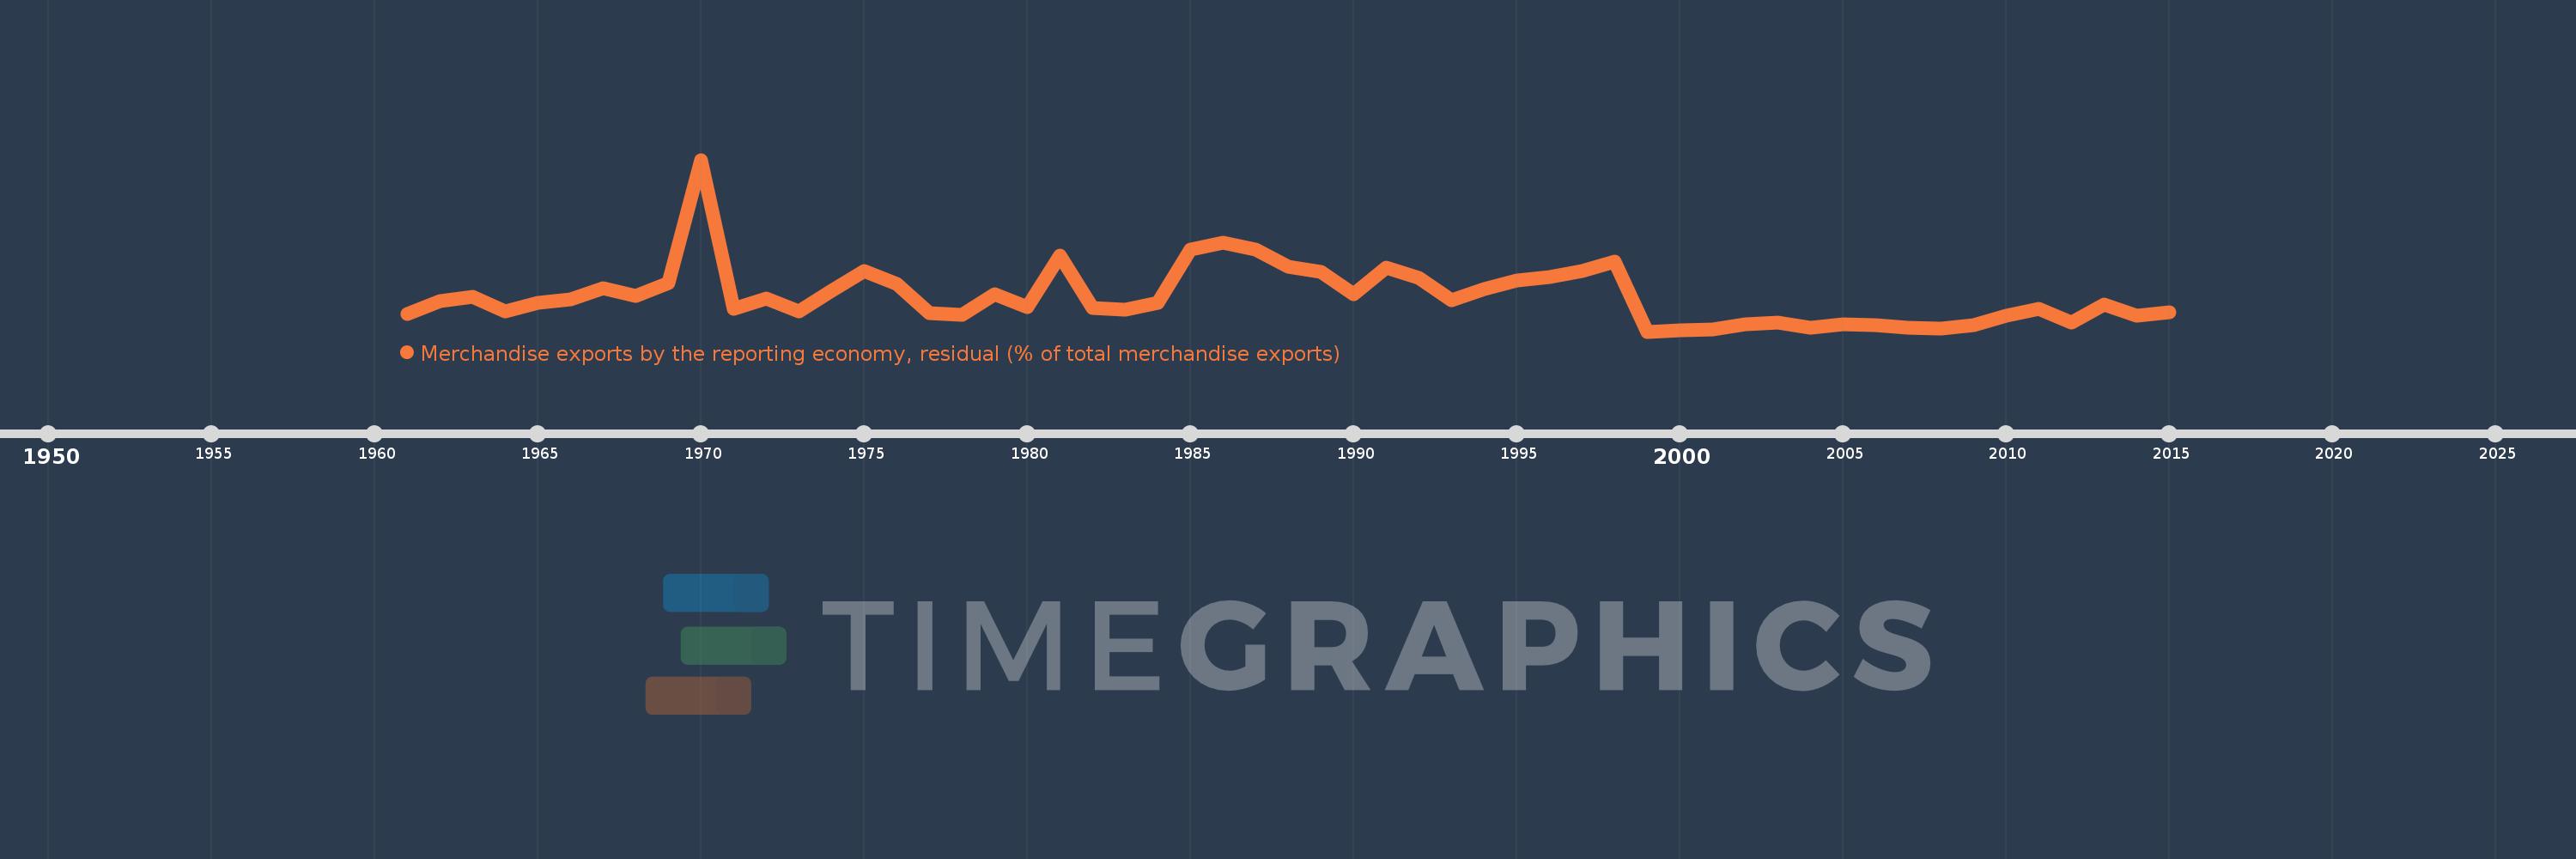
Merchandise exports by the reporting economy, residual (% of total merchandise exports)
2015,2014,2013,2012,2011,2010,2009,2008,2007,2006,2005,2004,2003,2002,2001,2000,1999,1998,1997,1996,1995,1994,1993,1992,1991,1990,1989,1988,1987,1986,1985,1984,1983,1982,1981,1980,1979,1978,1977,1976,1975,1974,1973,1972,1971,1970,1969,1968,1967,1966,1965,1964,1963,1962,1961
This statistics in other country:
AfghanistanAlbaniaAlgeriaAmerican SamoaAngolaAntigua and BarbudaArab WorldArgentinaArmeniaArubaAustraliaAustriaAzerbaijanBahamas, TheBahrainBangladeshBarbadosBelarusBelgiumBelizeBeninBermudaBoliviaBosnia and HerzegovinaBrazilBrunei DarussalamBulgariaBurkina FasoBurundiCabo VerdeCambodiaCameroonCanadaCaribbean small statesCentral African RepublicCentral Europe and the BalticsChadChileChinaColombiaComorosCongo, Dem. Rep.Congo, Rep.Costa RicaCote d'IvoireCroatiaCubaCyprusCzech RepublicDenmarkDjiboutiDominicaDominican RepublicEarly-demographic dividendEast Asia & PacificEast Asia & Pacific (excluding high income)East Asia & Pacific (IDA & IBRD countries)EcuadorEgypt, Arab Rep.El SalvadorEquatorial GuineaEstoniaEthiopiaEuro areaEurope & Central AsiaEurope & Central Asia (excluding high income)Europe & Central Asia (IDA & IBRD countries)European UnionFaroe IslandsFijiFinlandFragile and conflict affected situationsFranceFrench PolynesiaGabonGambia, TheGeorgiaGermanyGhanaGibraltarGreeceGreenlandGrenadaGuamGuatemalaGuineaGuinea-BissauGuyanaHaitiHeavily indebted poor countries (HIPC)High incomeHondurasHong Kong SAR, ChinaHungaryIBRD onlyIcelandIDA & IBRD totalIDA blendIDA onlyIDA totalIndiaIndonesiaIran, Islamic Rep.IraqIrelandIsraelItalyJamaicaJapanJordanKazakhstanKenyaKiribatiKorea, Dem. People’s Rep.Korea, Rep.KosovoKuwaitKyrgyz RepublicLao PDRLate-demographic dividendLatin America & Caribbean Latin America & Caribbean (excluding high income)Latin America & the Caribbean (IDA & IBRD countries)LatviaLeast developed countries: UN classificationLebanonLiberiaLibyaLithuaniaLow & middle incomeLow incomeLower middle incomeLuxembourgMacao SAR, ChinaMacedonia, FYRMadagascarMalawiMalaysiaMaldivesMaliMaltaMauritaniaMauritiusMexicoMiddle East & North AfricaMiddle East & North Africa (excluding high income)Middle East & North Africa (IDA & IBRD countries)Middle incomeMoldovaMongoliaMontenegroMoroccoMozambiqueMyanmarNauruNepalNetherlandsNew CaledoniaNew ZealandNicaraguaNigerNigeriaNorth AmericaNorwayOECD membersOmanOther small statesPacific island small statesPakistanPanamaPapua New GuineaParaguayPeruPhilippinesPolandPortugalPost-demographic dividendPre-demographic dividendQatarRomaniaRussian FederationRwandaSamoaSao Tome and PrincipeSaudi ArabiaSenegalSerbiaSeychellesSierra LeoneSingaporeSlovak RepublicSloveniaSmall statesSolomon IslandsSomaliaSouth AfricaSouth AsiaSouth Asia (IDA & IBRD)SpainSri LankaSt. Kitts and NevisSt. LuciaSt. Vincent and the GrenadinesSub-Saharan Africa Sub-Saharan Africa (excluding high income)Sub-Saharan Africa (IDA & IBRD countries)SudanSurinameSwedenSwitzerlandSyrian Arab RepublicTajikistanTanzaniaThailandTogoTongaTrinidad and TobagoTunisiaTurkeyTurkmenistanTuvaluUgandaUkraineUnited Arab EmiratesUnited KingdomUnited StatesUpper middle incomeUruguayUzbekistanVanuatuVenezuela, RBVietnamWorldYemen, Rep.ZambiaZimbabwe Timeline:
This timeline shows a graph from 1961 to 2015 of Jamaica. No data until 1960. Number of actual observations by date: 55.
Source name:
World Development Indicators
Source organization:
World Bank staff estimates based data from International Monetary Fund's Direction of Trade database.
Categories, topics:
Private Sector, Trade
Last updated:
apr 23, 2017
Indicators value changes by year
Maximum:
13.183
jan 1, 1970
At the date of observation
Value
Absolute change
Change from previous value
jan 1, 1961
1.705
+1.705
0.0%
jan 1, 1962
2.654
+0.95
55.72%
jan 1, 1963
2.988
+0.334
12.58%
jan 1, 1964
1.874
-1.115
-37.3%
jan 1, 1965
2.529
+0.655
34.95%
jan 1, 1966
2.762
+0.233
9.23%
jan 1, 1967
3.643
+0.881
31.89%
jan 1, 1968
3.062
-0.581
-15.96%
jan 1, 1969
4.015
+0.953
31.12%
jan 1, 1970
13.183
+9.169
228.38%
jan 1, 1971
2.073
-11.11
-84.28%
jan 1, 1972
2.858
+0.785
37.88%
jan 1, 1973
1.885
-0.973
-34.04%
jan 1, 1974
3.454
+1.57
83.28%
jan 1, 1975
4.891
+1.436
41.58%
jan 1, 1976
3.92
-0.971
-19.85%
jan 1, 1977
1.746
-2.174
-55.45%
jan 1, 1978
1.655
-0.091
-5.2%
jan 1, 1979
3.193
+1.538
92.88%
jan 1, 1980
2.197
-0.996
-31.18%
jan 1, 1981
6.06
+3.862
175.77%
jan 1, 1982
2.122
-3.938
-64.99%
jan 1, 1983
2.009
-0.113
-5.31%
jan 1, 1984
2.562
+0.552
27.5%
jan 1, 1985
6.525
+3.964
154.73%
jan 1, 1986
7.0
+0.475
7.28%
jan 1, 1987
6.496
-0.505
-7.21%
jan 1, 1988
5.253
-1.243
-19.13%
jan 1, 1989
4.831
-0.422
-8.03%
jan 1, 1990
3.148
-1.683
-34.85%
jan 1, 1991
5.144
+1.997
63.43%
jan 1, 1992
4.366
-0.778
-15.12%
jan 1, 1993
2.698
-1.668
-38.21%
jan 1, 1994
3.537
+0.839
31.08%
jan 1, 1995
4.217
+0.68
19.24%
jan 1, 1996
4.442
+0.225
5.34%
jan 1, 1997
4.915
+0.473
10.64%
jan 1, 1998
5.584
+0.669
13.61%
jan 1, 1999
0.395
-5.189
-92.93%
jan 1, 2000
0.497
+0.103
25.96%
jan 1, 2001
0.573
+0.075
15.12%
jan 1, 2002
0.949
+0.376
65.69%
jan 1, 2003
1.089
+0.14
14.75%
jan 1, 2004
0.7
-0.389
-35.74%
jan 1, 2005
0.941
+0.242
34.53%
jan 1, 2006
0.885
-0.056
-5.98%
jan 1, 2007
0.696
-0.189
-21.31%
jan 1, 2008
0.648
-0.049
-6.97%
jan 1, 2009
0.846
+0.198
30.58%
jan 1, 2010
1.556
+0.71
83.91%
jan 1, 2011
2.063
+0.507
32.6%
jan 1, 2012
1.049
-1.013
-49.13%
jan 1, 2013
2.388
+1.338
127.55%
jan 1, 2014
1.583
-0.804
-33.69%
jan 1, 2015
1.829
+0.246
15.52%
Ranking of countries by current statistics by years


Comments: