29
/
en
AIzaSyAYiBZKx7MnpbEhh9jyipgxe19OcubqV5w
April 1, 2024
142062
Greece
GRC
true
2
1
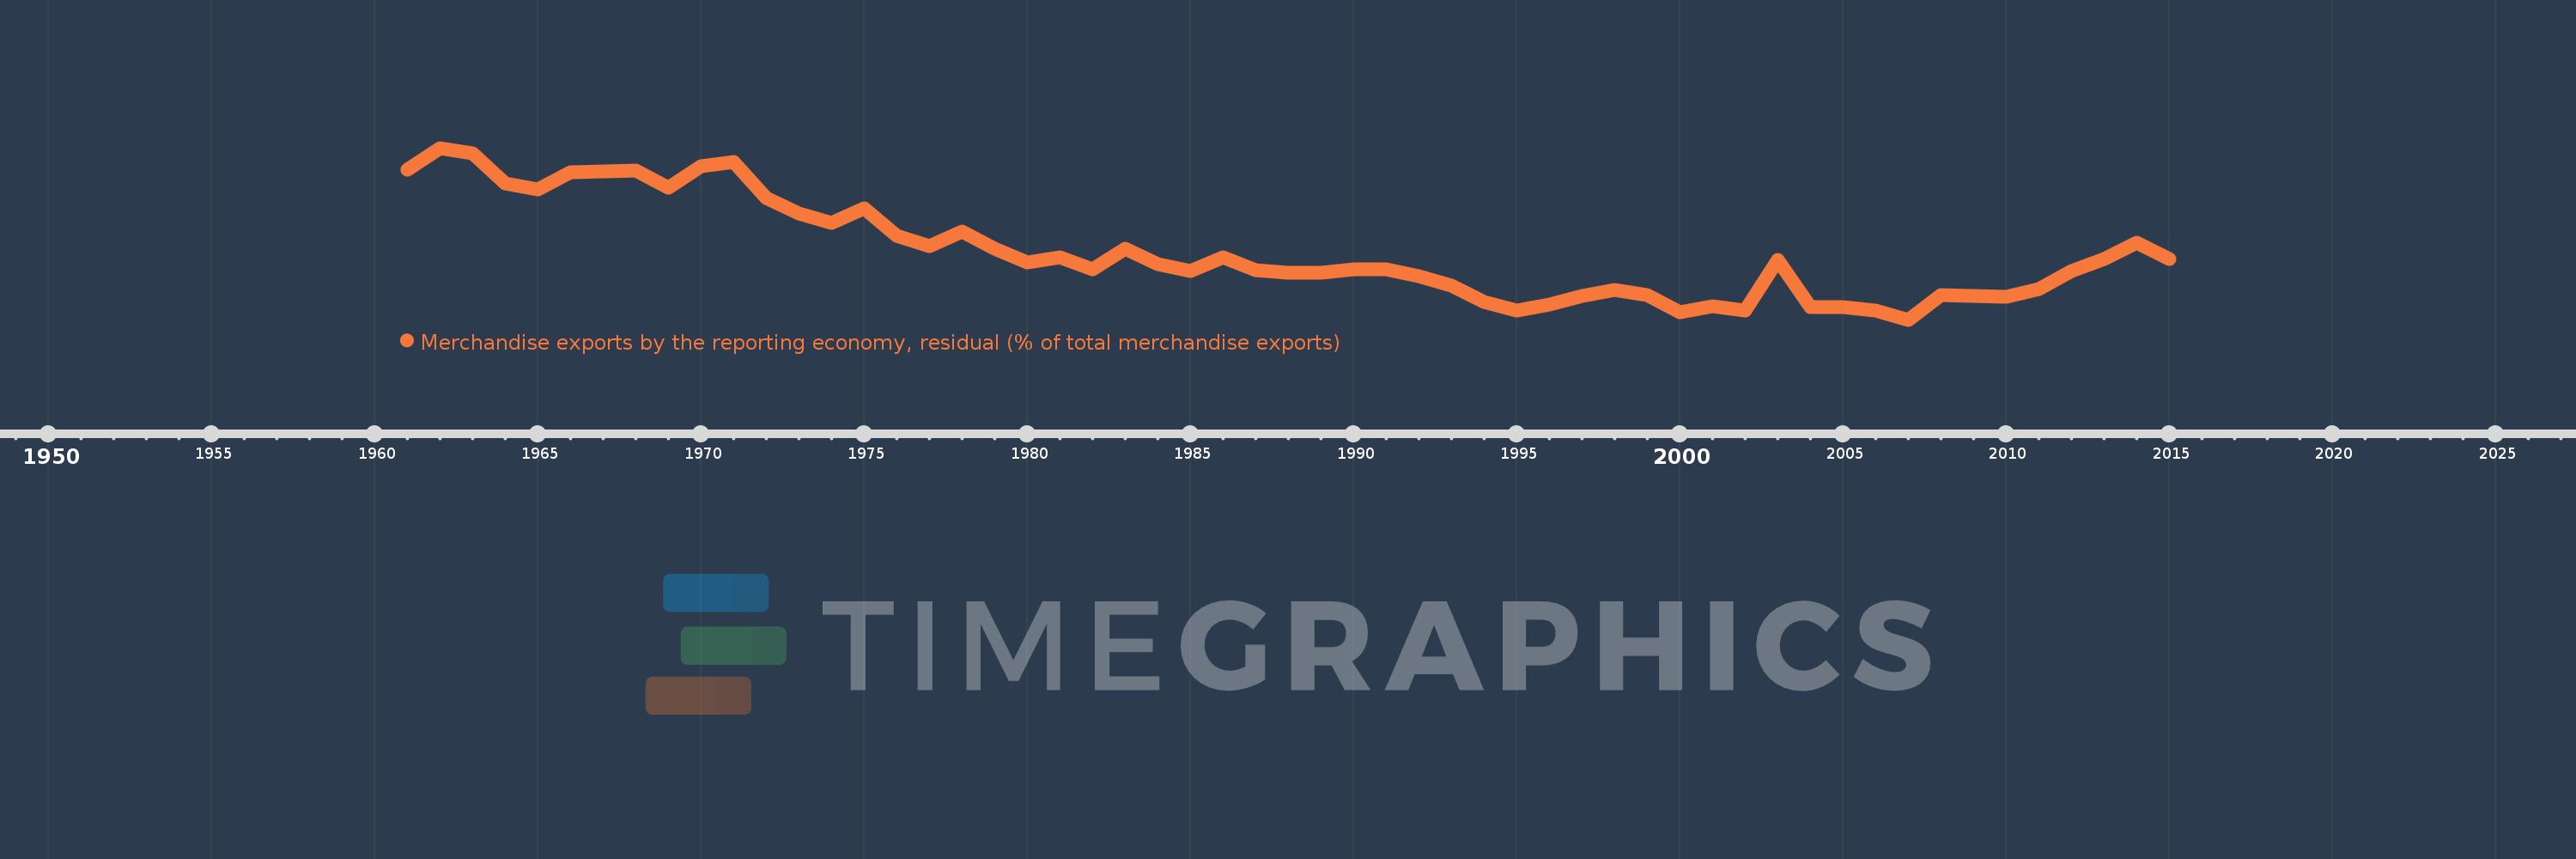
Merchandise exports by the reporting economy, residual (% of total merchandise exports)
2015,2014,2013,2012,2011,2010,2009,2008,2007,2006,2005,2004,2003,2002,2001,2000,1999,1998,1997,1996,1995,1994,1993,1992,1991,1990,1989,1988,1987,1986,1985,1984,1983,1982,1981,1980,1979,1978,1977,1976,1975,1974,1973,1972,1971,1970,1969,1968,1967,1966,1965,1964,1963,1962,1961
This statistics in other country:
AfghanistanAlbaniaAlgeriaAmerican SamoaAngolaAntigua and BarbudaArab WorldArgentinaArmeniaArubaAustraliaAustriaAzerbaijanBahamas, TheBahrainBangladeshBarbadosBelarusBelgiumBelizeBeninBermudaBoliviaBosnia and HerzegovinaBrazilBrunei DarussalamBulgariaBurkina FasoBurundiCabo VerdeCambodiaCameroonCanadaCaribbean small statesCentral African RepublicCentral Europe and the BalticsChadChileChinaColombiaComorosCongo, Dem. Rep.Congo, Rep.Costa RicaCote d'IvoireCroatiaCubaCyprusCzech RepublicDenmarkDjiboutiDominicaDominican RepublicEarly-demographic dividendEast Asia & PacificEast Asia & Pacific (excluding high income)East Asia & Pacific (IDA & IBRD countries)EcuadorEgypt, Arab Rep.El SalvadorEquatorial GuineaEstoniaEthiopiaEuro areaEurope & Central AsiaEurope & Central Asia (excluding high income)Europe & Central Asia (IDA & IBRD countries)European UnionFaroe IslandsFijiFinlandFragile and conflict affected situationsFranceFrench PolynesiaGabonGambia, TheGeorgiaGermanyGhanaGibraltarGreeceGreenlandGrenadaGuamGuatemalaGuineaGuinea-BissauGuyanaHaitiHeavily indebted poor countries (HIPC)High incomeHondurasHong Kong SAR, ChinaHungaryIBRD onlyIcelandIDA & IBRD totalIDA blendIDA onlyIDA totalIndiaIndonesiaIran, Islamic Rep.IraqIrelandIsraelItalyJamaicaJapanJordanKazakhstanKenyaKiribatiKorea, Dem. People’s Rep.Korea, Rep.KosovoKuwaitKyrgyz RepublicLao PDRLate-demographic dividendLatin America & Caribbean Latin America & Caribbean (excluding high income)Latin America & the Caribbean (IDA & IBRD countries)LatviaLeast developed countries: UN classificationLebanonLiberiaLibyaLithuaniaLow & middle incomeLow incomeLower middle incomeLuxembourgMacao SAR, ChinaMacedonia, FYRMadagascarMalawiMalaysiaMaldivesMaliMaltaMauritaniaMauritiusMexicoMiddle East & North AfricaMiddle East & North Africa (excluding high income)Middle East & North Africa (IDA & IBRD countries)Middle incomeMoldovaMongoliaMontenegroMoroccoMozambiqueMyanmarNauruNepalNetherlandsNew CaledoniaNew ZealandNicaraguaNigerNigeriaNorth AmericaNorwayOECD membersOmanOther small statesPacific island small statesPakistanPanamaPapua New GuineaParaguayPeruPhilippinesPolandPortugalPost-demographic dividendPre-demographic dividendQatarRomaniaRussian FederationRwandaSamoaSao Tome and PrincipeSaudi ArabiaSenegalSerbiaSeychellesSierra LeoneSingaporeSlovak RepublicSloveniaSmall statesSolomon IslandsSomaliaSouth AfricaSouth AsiaSouth Asia (IDA & IBRD)SpainSri LankaSt. Kitts and NevisSt. LuciaSt. Vincent and the GrenadinesSub-Saharan Africa Sub-Saharan Africa (excluding high income)Sub-Saharan Africa (IDA & IBRD countries)SudanSurinameSwedenSwitzerlandSyrian Arab RepublicTajikistanTanzaniaThailandTogoTongaTrinidad and TobagoTunisiaTurkeyTurkmenistanTuvaluUgandaUkraineUnited Arab EmiratesUnited KingdomUnited StatesUpper middle incomeUruguayUzbekistanVanuatuVenezuela, RBVietnamWorldYemen, Rep.ZambiaZimbabwe Timeline:
This timeline shows a graph from 1961 to 2015 of Greece. No data until 1960. Number of actual observations by date: 55.
Source name:
World Development Indicators
Source organization:
World Bank staff estimates based data from International Monetary Fund's Direction of Trade database.
Categories, topics:
Private Sector, Trade
Last updated:
apr 23, 2017
Indicators value changes by year
Maximum:
21.753
jan 1, 1962
At the date of observation
Value
Absolute change
Change from previous value
jan 1, 1961
19.153
+19.153
0.0%
jan 1, 1962
21.753
+2.6
13.57%
jan 1, 1963
21.144
-0.609
-2.8%
jan 1, 1964
17.574
-3.57
-16.88%
jan 1, 1965
16.845
-0.729
-4.15%
jan 1, 1966
18.864
+2.02
11.99%
jan 1, 1967
18.941
+0.076
0.41%
jan 1, 1968
19.078
+0.138
0.73%
jan 1, 1969
17.012
-2.066
-10.83%
jan 1, 1970
19.545
+2.533
14.89%
jan 1, 1971
20.058
+0.513
2.63%
jan 1, 1972
15.837
-4.221
-21.04%
jan 1, 1973
13.997
-1.84
-11.62%
jan 1, 1974
12.909
-1.088
-7.77%
jan 1, 1975
14.588
+1.679
13.0%
jan 1, 1976
11.325
-3.263
-22.37%
jan 1, 1977
10.086
-1.239
-10.94%
jan 1, 1978
11.898
+1.812
17.96%
jan 1, 1979
9.85
-2.048
-17.21%
jan 1, 1980
8.168
-1.682
-17.08%
jan 1, 1981
8.843
+0.675
8.26%
jan 1, 1982
7.364
-1.478
-16.72%
jan 1, 1983
9.785
+2.421
32.88%
jan 1, 1984
8.009
-1.777
-18.16%
jan 1, 1985
7.194
-0.815
-10.18%
jan 1, 1986
8.846
+1.652
22.97%
jan 1, 1987
7.224
-1.622
-18.34%
jan 1, 1988
6.993
-0.231
-3.19%
jan 1, 1989
6.947
-0.046
-0.65%
jan 1, 1990
7.351
+0.404
5.81%
jan 1, 1991
7.416
+0.064
0.87%
jan 1, 1992
6.575
-0.841
-11.34%
jan 1, 1993
5.44
-1.135
-17.26%
jan 1, 1994
3.512
-1.928
-35.45%
jan 1, 1995
2.521
-0.991
-28.22%
jan 1, 1996
3.206
+0.686
27.2%
jan 1, 1997
4.18
+0.974
30.37%
jan 1, 1998
4.887
+0.707
16.91%
jan 1, 1999
4.304
-0.583
-11.94%
jan 1, 2000
2.253
-2.051
-47.65%
jan 1, 2001
2.949
+0.697
30.93%
jan 1, 2002
2.5
-0.45
-15.25%
jan 1, 2003
8.504
+6.005
240.21%
jan 1, 2004
2.898
-5.606
-65.92%
jan 1, 2005
2.881
-0.017
-0.6%
jan 1, 2006
2.44
-0.441
-15.32%
jan 1, 2007
1.402
-1.038
-42.54%
jan 1, 2008
4.272
+2.87
204.68%
jan 1, 2009
4.172
-0.1
-2.34%
jan 1, 2010
4.075
-0.096
-2.31%
jan 1, 2011
5.074
+0.998
24.49%
jan 1, 2012
7.163
+2.089
41.18%
jan 1, 2013
8.619
+1.456
20.32%
jan 1, 2014
10.488
+1.869
21.69%
jan 1, 2015
8.574
-1.914
-18.25%
Ranking of countries by current statistics by years


Comments: