29
/
en
AIzaSyAYiBZKx7MnpbEhh9jyipgxe19OcubqV5w
April 1, 2024
227635
Qatar
QAT
true
2
1
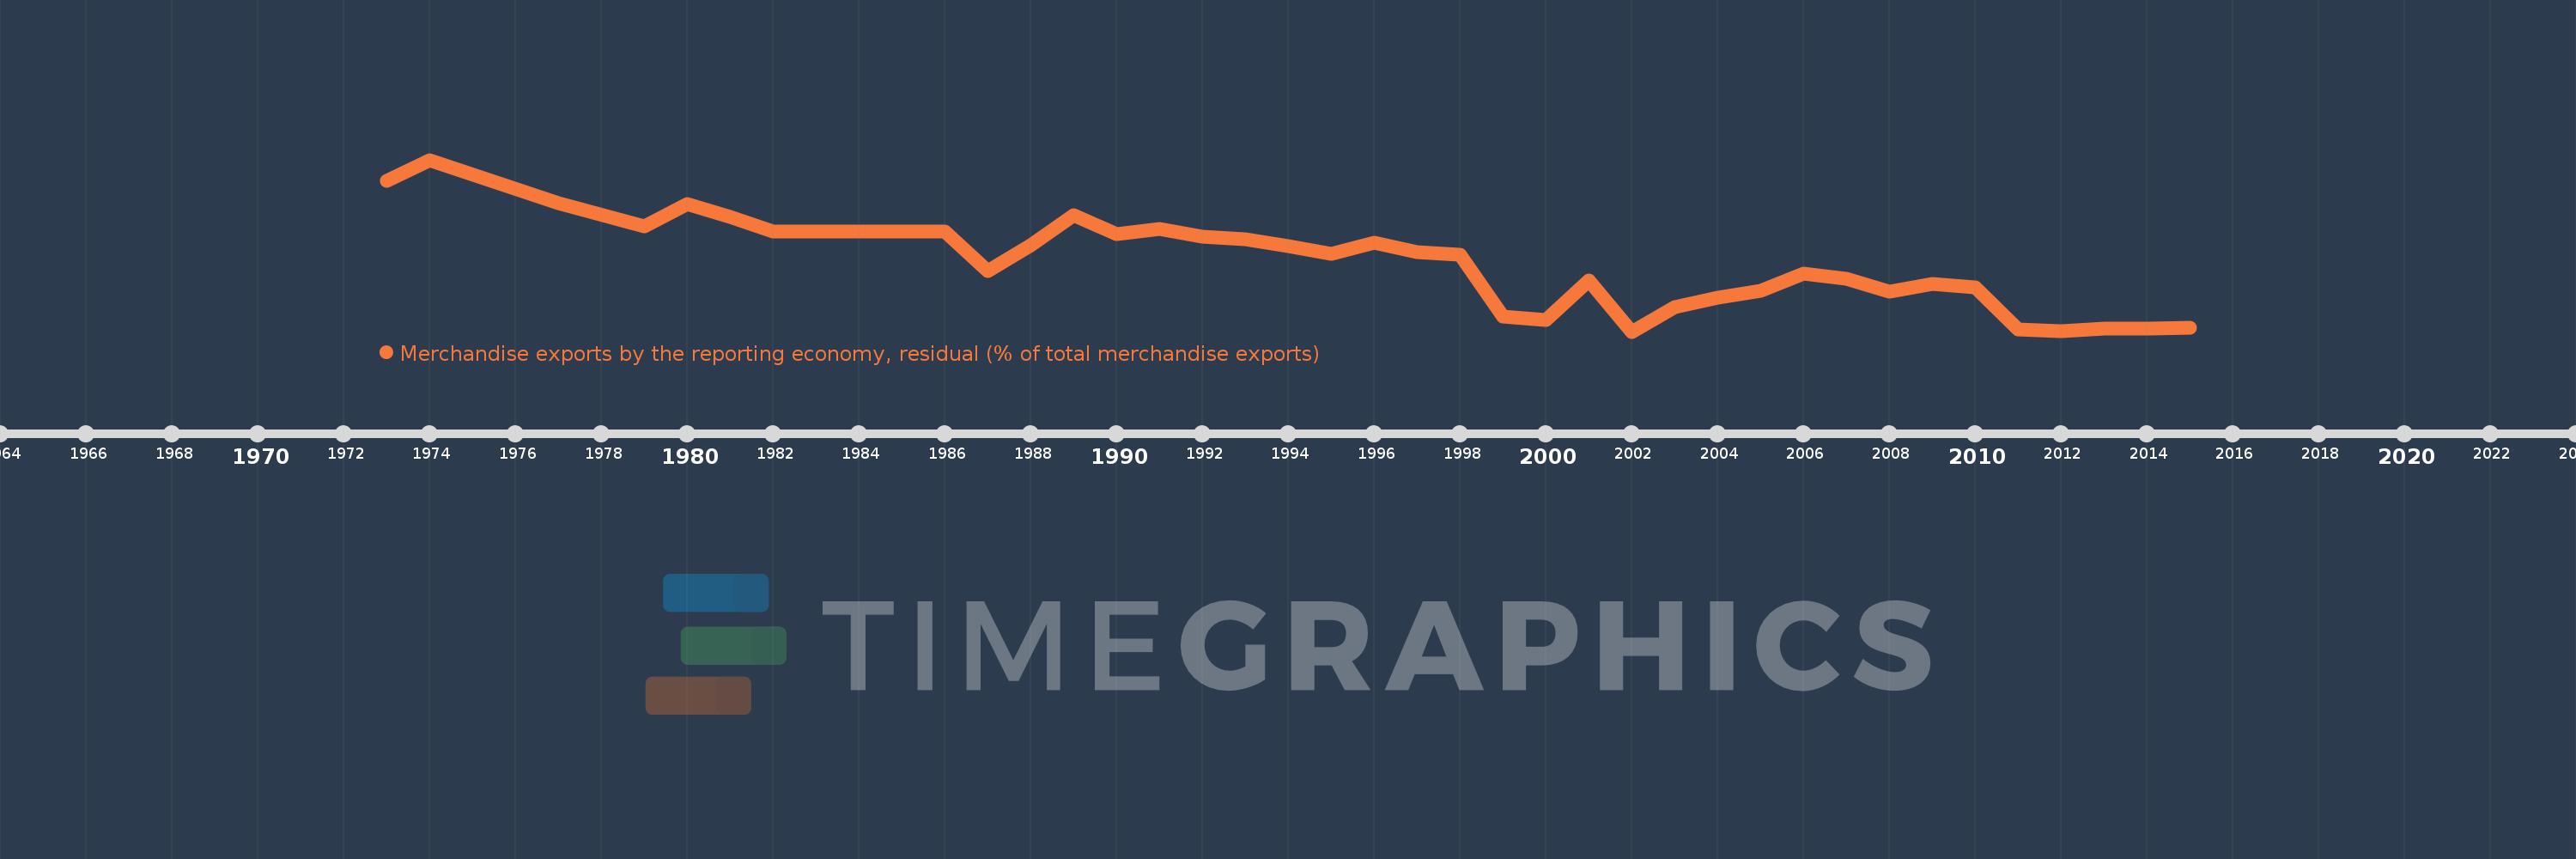
Merchandise exports by the reporting economy, residual (% of total merchandise exports)
2015,2014,2013,2012,2011,2010,2009,2008,2007,2006,2005,2004,2003,2002,2001,2000,1999,1998,1997,1996,1995,1994,1993,1992,1991,1990,1989,1988,1987,1986,1985,1984,1983,1982,1981,1980,1979,1977,1974,1973
This statistics in other country:
AfghanistanAlbaniaAlgeriaAmerican SamoaAngolaAntigua and BarbudaArab WorldArgentinaArmeniaArubaAustraliaAustriaAzerbaijanBahamas, TheBahrainBangladeshBarbadosBelarusBelgiumBelizeBeninBermudaBoliviaBosnia and HerzegovinaBrazilBrunei DarussalamBulgariaBurkina FasoBurundiCabo VerdeCambodiaCameroonCanadaCaribbean small statesCentral African RepublicCentral Europe and the BalticsChadChileChinaColombiaComorosCongo, Dem. Rep.Congo, Rep.Costa RicaCote d'IvoireCroatiaCubaCyprusCzech RepublicDenmarkDjiboutiDominicaDominican RepublicEarly-demographic dividendEast Asia & PacificEast Asia & Pacific (excluding high income)East Asia & Pacific (IDA & IBRD countries)EcuadorEgypt, Arab Rep.El SalvadorEquatorial GuineaEstoniaEthiopiaEuro areaEurope & Central AsiaEurope & Central Asia (excluding high income)Europe & Central Asia (IDA & IBRD countries)European UnionFaroe IslandsFijiFinlandFragile and conflict affected situationsFranceFrench PolynesiaGabonGambia, TheGeorgiaGermanyGhanaGibraltarGreeceGreenlandGrenadaGuamGuatemalaGuineaGuinea-BissauGuyanaHaitiHeavily indebted poor countries (HIPC)High incomeHondurasHong Kong SAR, ChinaHungaryIBRD onlyIcelandIDA & IBRD totalIDA blendIDA onlyIDA totalIndiaIndonesiaIran, Islamic Rep.IraqIrelandIsraelItalyJamaicaJapanJordanKazakhstanKenyaKiribatiKorea, Dem. People’s Rep.Korea, Rep.KosovoKuwaitKyrgyz RepublicLao PDRLate-demographic dividendLatin America & Caribbean Latin America & Caribbean (excluding high income)Latin America & the Caribbean (IDA & IBRD countries)LatviaLeast developed countries: UN classificationLebanonLiberiaLibyaLithuaniaLow & middle incomeLow incomeLower middle incomeLuxembourgMacao SAR, ChinaMacedonia, FYRMadagascarMalawiMalaysiaMaldivesMaliMaltaMauritaniaMauritiusMexicoMiddle East & North AfricaMiddle East & North Africa (excluding high income)Middle East & North Africa (IDA & IBRD countries)Middle incomeMoldovaMongoliaMontenegroMoroccoMozambiqueMyanmarNauruNepalNetherlandsNew CaledoniaNew ZealandNicaraguaNigerNigeriaNorth AmericaNorwayOECD membersOmanOther small statesPacific island small statesPakistanPanamaPapua New GuineaParaguayPeruPhilippinesPolandPortugalPost-demographic dividendPre-demographic dividendQatarRomaniaRussian FederationRwandaSamoaSao Tome and PrincipeSaudi ArabiaSenegalSerbiaSeychellesSierra LeoneSingaporeSlovak RepublicSloveniaSmall statesSolomon IslandsSomaliaSouth AfricaSouth AsiaSouth Asia (IDA & IBRD)SpainSri LankaSt. Kitts and NevisSt. LuciaSt. Vincent and the GrenadinesSub-Saharan Africa Sub-Saharan Africa (excluding high income)Sub-Saharan Africa (IDA & IBRD countries)SudanSurinameSwedenSwitzerlandSyrian Arab RepublicTajikistanTanzaniaThailandTogoTongaTrinidad and TobagoTunisiaTurkeyTurkmenistanTuvaluUgandaUkraineUnited Arab EmiratesUnited KingdomUnited StatesUpper middle incomeUruguayUzbekistanVanuatuVenezuela, RBVietnamWorldYemen, Rep.ZambiaZimbabwe Timeline:
This timeline shows a graph from 1973 to 2015 of Qatar. No data until 1972. Number of actual observations by date: 40.
Source name:
World Development Indicators
Source organization:
World Bank staff estimates based data from International Monetary Fund's Direction of Trade database.
Categories, topics:
Private Sector, Trade
Last updated:
apr 23, 2017
Indicators value changes by year
Maximum:
32.486
jan 1, 1974
At the date of observation
Value
Absolute change
Change from previous value
jan 1, 1973
28.55
+28.55
0.0%
jan 1, 1974
32.486
+3.936
13.79%
jan 1, 1977
24.357
-8.129
-25.02%
jan 1, 1979
19.905
-4.452
-18.28%
jan 1, 1980
24.136
+4.231
21.26%
jan 1, 1981
21.791
-2.346
-9.72%
jan 1, 1982
18.876
-2.915
-13.38%
jan 1, 1983
18.876
+0.0
0.0%
jan 1, 1984
18.876
0.0
0.0%
jan 1, 1985
18.876
+0.0
0.0%
jan 1, 1986
18.876
+0.0
0.0%
jan 1, 1987
11.45
-7.426
-39.34%
jan 1, 1988
16.286
+4.836
42.24%
jan 1, 1989
22.045
+5.759
35.36%
jan 1, 1990
18.447
-3.598
-16.32%
jan 1, 1991
19.407
+0.96
5.21%
jan 1, 1992
18.026
-1.381
-7.12%
jan 1, 1993
17.464
-0.561
-3.11%
jan 1, 1994
16.24
-1.224
-7.01%
jan 1, 1995
14.68
-1.56
-9.61%
jan 1, 1996
16.824
+2.144
14.6%
jan 1, 1997
15.14
-1.684
-10.01%
jan 1, 1998
14.594
-0.546
-3.61%
jan 1, 1999
2.841
-11.753
-80.53%
jan 1, 2000
2.205
-0.636
-22.37%
jan 1, 2001
9.763
+7.558
342.71%
jan 1, 2002
0.081
-9.682
-99.17%
jan 1, 2003
4.734
+4.653
5.76K%
jan 1, 2004
6.551
+1.816
38.37%
jan 1, 2005
7.856
+1.306
19.93%
jan 1, 2006
10.962
+3.106
39.53%
jan 1, 2007
9.995
-0.968
-8.83%
jan 1, 2008
7.604
-2.39
-23.92%
jan 1, 2009
9.102
+1.497
19.69%
jan 1, 2010
8.413
-0.689
-7.57%
jan 1, 2011
0.507
-7.907
-93.98%
jan 1, 2012
0.113
-0.394
-77.73%
jan 1, 2013
0.724
+0.611
542.07%
jan 1, 2014
0.637
-0.087
-12.07%
jan 1, 2015
0.74
+0.103
16.15%
Ranking of countries by current statistics by years


Comments: