29
/
en
AIzaSyAYiBZKx7MnpbEhh9jyipgxe19OcubqV5w
April 1, 2024
257550
Switzerland
CHE
true
2
1
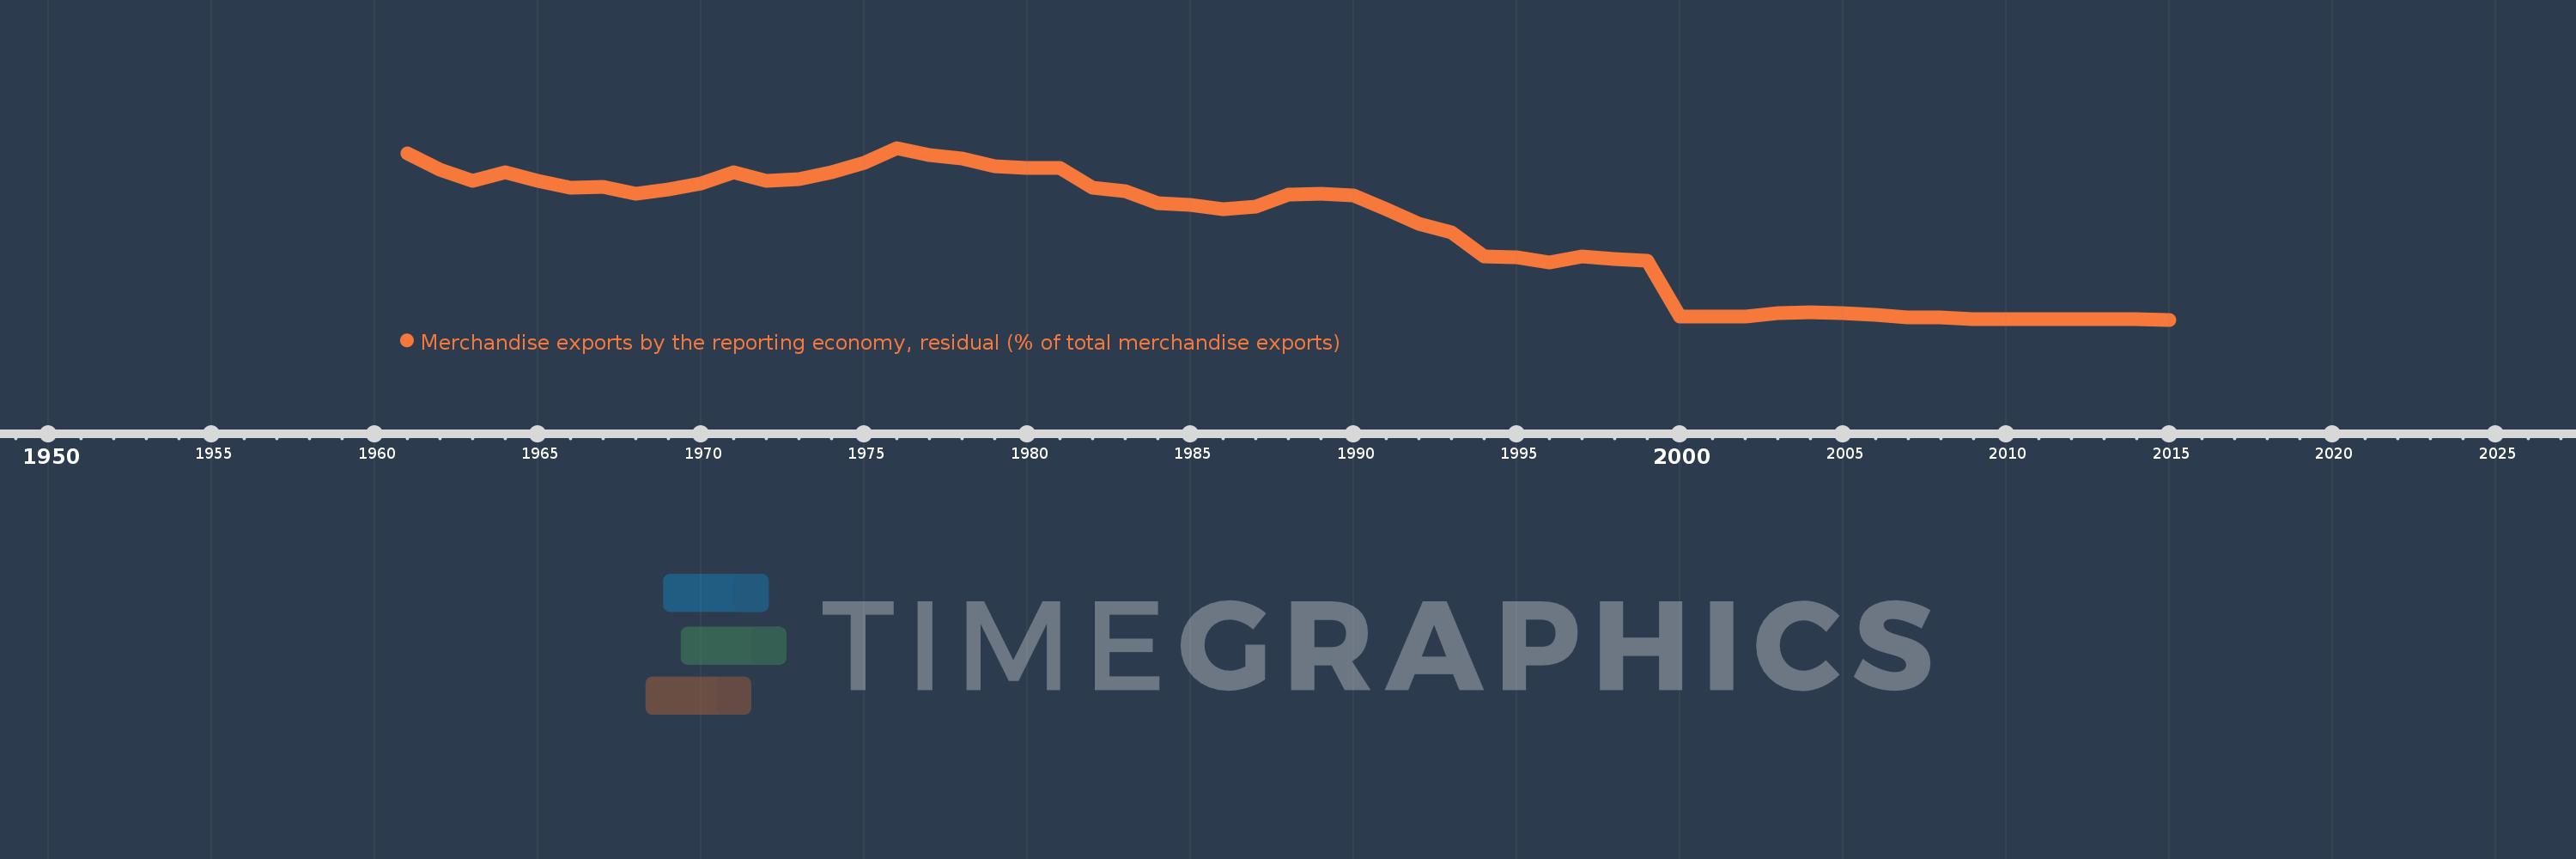
Merchandise exports by the reporting economy, residual (% of total merchandise exports)
2015,2014,2013,2012,2011,2010,2009,2008,2007,2006,2005,2004,2003,2002,2001,2000,1999,1998,1997,1996,1995,1994,1993,1992,1991,1990,1989,1988,1987,1986,1985,1984,1983,1982,1981,1980,1979,1978,1977,1976,1975,1974,1973,1972,1971,1970,1969,1968,1967,1966,1965,1964,1963,1962,1961
This statistics in other country:
AfghanistanAlbaniaAlgeriaAmerican SamoaAngolaAntigua and BarbudaArab WorldArgentinaArmeniaArubaAustraliaAustriaAzerbaijanBahamas, TheBahrainBangladeshBarbadosBelarusBelgiumBelizeBeninBermudaBoliviaBosnia and HerzegovinaBrazilBrunei DarussalamBulgariaBurkina FasoBurundiCabo VerdeCambodiaCameroonCanadaCaribbean small statesCentral African RepublicCentral Europe and the BalticsChadChileChinaColombiaComorosCongo, Dem. Rep.Congo, Rep.Costa RicaCote d'IvoireCroatiaCubaCyprusCzech RepublicDenmarkDjiboutiDominicaDominican RepublicEarly-demographic dividendEast Asia & PacificEast Asia & Pacific (excluding high income)East Asia & Pacific (IDA & IBRD countries)EcuadorEgypt, Arab Rep.El SalvadorEquatorial GuineaEstoniaEthiopiaEuro areaEurope & Central AsiaEurope & Central Asia (excluding high income)Europe & Central Asia (IDA & IBRD countries)European UnionFaroe IslandsFijiFinlandFragile and conflict affected situationsFranceFrench PolynesiaGabonGambia, TheGeorgiaGermanyGhanaGibraltarGreeceGreenlandGrenadaGuamGuatemalaGuineaGuinea-BissauGuyanaHaitiHeavily indebted poor countries (HIPC)High incomeHondurasHong Kong SAR, ChinaHungaryIBRD onlyIcelandIDA & IBRD totalIDA blendIDA onlyIDA totalIndiaIndonesiaIran, Islamic Rep.IraqIrelandIsraelItalyJamaicaJapanJordanKazakhstanKenyaKiribatiKorea, Dem. People’s Rep.Korea, Rep.KosovoKuwaitKyrgyz RepublicLao PDRLate-demographic dividendLatin America & Caribbean Latin America & Caribbean (excluding high income)Latin America & the Caribbean (IDA & IBRD countries)LatviaLeast developed countries: UN classificationLebanonLiberiaLibyaLithuaniaLow & middle incomeLow incomeLower middle incomeLuxembourgMacao SAR, ChinaMacedonia, FYRMadagascarMalawiMalaysiaMaldivesMaliMaltaMauritaniaMauritiusMexicoMiddle East & North AfricaMiddle East & North Africa (excluding high income)Middle East & North Africa (IDA & IBRD countries)Middle incomeMoldovaMongoliaMontenegroMoroccoMozambiqueMyanmarNauruNepalNetherlandsNew CaledoniaNew ZealandNicaraguaNigerNigeriaNorth AmericaNorwayOECD membersOmanOther small statesPacific island small statesPakistanPanamaPapua New GuineaParaguayPeruPhilippinesPolandPortugalPost-demographic dividendPre-demographic dividendQatarRomaniaRussian FederationRwandaSamoaSao Tome and PrincipeSaudi ArabiaSenegalSerbiaSeychellesSierra LeoneSingaporeSlovak RepublicSloveniaSmall statesSolomon IslandsSomaliaSouth AfricaSouth AsiaSouth Asia (IDA & IBRD)SpainSri LankaSt. Kitts and NevisSt. LuciaSt. Vincent and the GrenadinesSub-Saharan Africa Sub-Saharan Africa (excluding high income)Sub-Saharan Africa (IDA & IBRD countries)SudanSurinameSwedenSwitzerlandSyrian Arab RepublicTajikistanTanzaniaThailandTogoTongaTrinidad and TobagoTunisiaTurkeyTurkmenistanTuvaluUgandaUkraineUnited Arab EmiratesUnited KingdomUnited StatesUpper middle incomeUruguayUzbekistanVanuatuVenezuela, RBVietnamWorldYemen, Rep.ZambiaZimbabwe Timeline:
This timeline shows a graph from 1961 to 2015 of Switzerland. No data until 1960. Number of actual observations by date: 55.
Source name:
World Development Indicators
Source organization:
World Bank staff estimates based data from International Monetary Fund's Direction of Trade database.
Categories, topics:
Private Sector, Trade
Last updated:
apr 23, 2017
Indicators value changes by year
At the date of observation
Value
Absolute change
Change from previous value
jan 1, 1961
6.905
+6.905
0.0%
jan 1, 1962
6.256
-0.649
-9.4%
jan 1, 1963
5.789
-0.468
-7.47%
jan 1, 1964
6.118
+0.33
5.7%
jan 1, 1965
5.789
-0.329
-5.39%
jan 1, 1966
5.508
-0.281
-4.86%
jan 1, 1967
5.525
+0.017
0.32%
jan 1, 1968
5.254
-0.271
-4.91%
jan 1, 1969
5.432
+0.178
3.39%
jan 1, 1970
5.674
+0.242
4.46%
jan 1, 1971
6.14
+0.465
8.2%
jan 1, 1972
5.775
-0.364
-5.94%
jan 1, 1973
5.835
+0.059
1.03%
jan 1, 1974
6.126
+0.291
4.99%
jan 1, 1975
6.536
+0.41
6.7%
jan 1, 1976
7.142
+0.606
9.27%
jan 1, 1977
6.859
-0.283
-3.96%
jan 1, 1978
6.703
-0.156
-2.27%
jan 1, 1979
6.39
-0.313
-4.67%
jan 1, 1980
6.305
-0.084
-1.32%
jan 1, 1981
6.32
+0.014
0.22%
jan 1, 1982
5.513
-0.806
-12.76%
jan 1, 1983
5.346
-0.167
-3.03%
jan 1, 1984
4.867
-0.479
-8.97%
jan 1, 1985
4.776
-0.09
-1.86%
jan 1, 1986
4.604
-0.173
-3.62%
jan 1, 1987
4.703
+0.099
2.15%
jan 1, 1988
5.209
+0.506
10.77%
jan 1, 1989
5.23
+0.021
0.4%
jan 1, 1990
5.171
-0.059
-1.12%
jan 1, 1991
4.605
-0.566
-10.94%
jan 1, 1992
3.996
-0.609
-13.22%
jan 1, 1993
3.637
-0.359
-8.99%
jan 1, 1994
2.661
-0.976
-26.83%
jan 1, 1995
2.613
-0.049
-1.82%
jan 1, 1996
2.406
-0.207
-7.92%
jan 1, 1997
2.668
+0.262
10.88%
jan 1, 1998
2.559
-0.108
-4.06%
jan 1, 1999
2.459
-0.1
-3.92%
jan 1, 2000
0.148
-2.311
-93.98%
jan 1, 2001
0.164
+0.016
11.09%
jan 1, 2002
0.171
+0.006
3.85%
jan 1, 2003
0.289
+0.118
68.94%
jan 1, 2004
0.332
+0.044
15.12%
jan 1, 2005
0.319
-0.013
-3.86%
jan 1, 2006
0.249
-0.07
-22.03%
jan 1, 2007
0.117
-0.132
-53.04%
jan 1, 2008
0.124
+0.007
6.28%
jan 1, 2009
0.05
-0.074
-59.91%
jan 1, 2010
0.054
+0.004
8.41%
jan 1, 2011
0.048
-0.006
-11.01%
jan 1, 2012
0.047
-0.001
-2.19%
jan 1, 2013
0.039
-0.008
-15.98%
jan 1, 2014
0.038
-0.002
-3.94%
jan 1, 2015
0.03
-0.008
-20.27%
Ranking of countries by current statistics by years


Comments: